Revvity, Inc. RVTY
Revenue Intelligence Report • 66 quarters of SEC filing data • Updated 2026-03-15
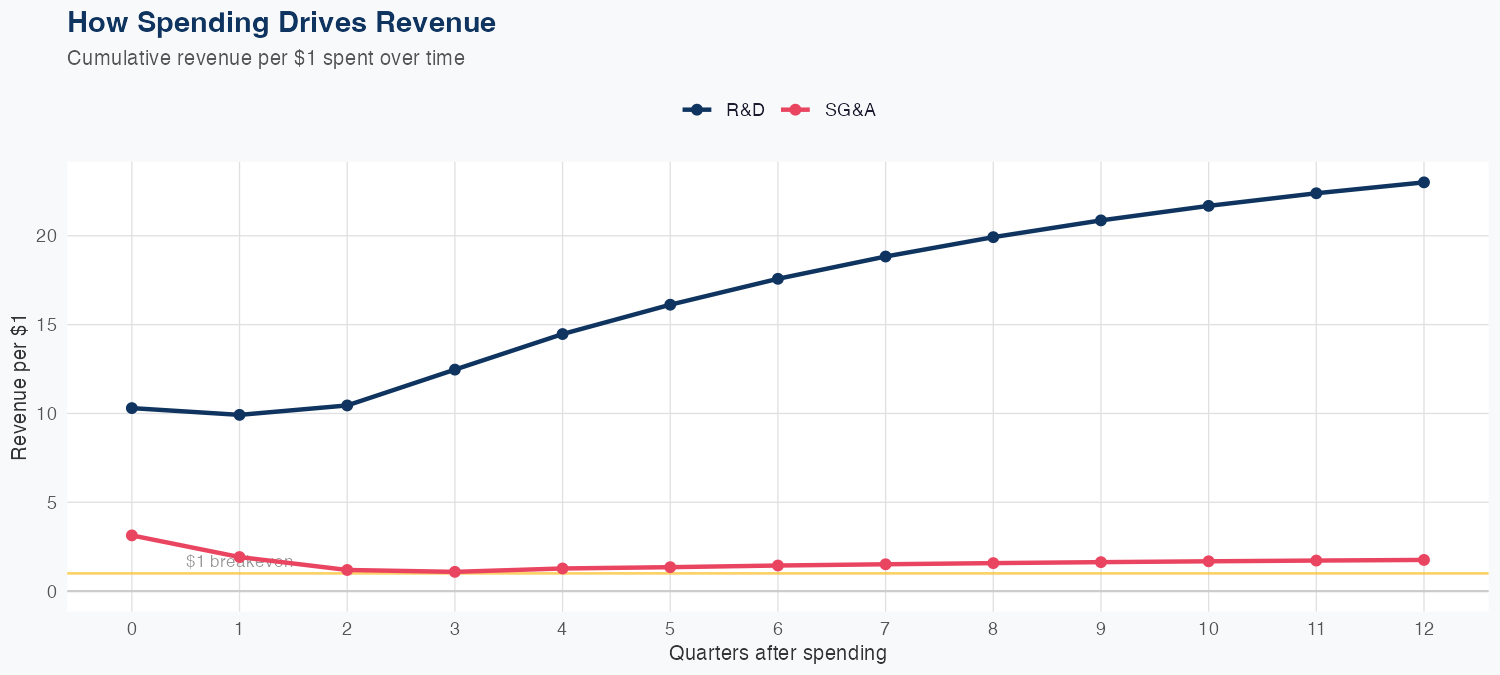
Revenue is primarily driven by R&D investment, with an estimated $14.10 in long-run revenue generated per $1 of R&D, compared with $2.34 per $1 of SG&A. The linear model built on 66 quarters of data shows a strong ROI hierarchy and a reasonable fit, with a 5.6% MAPE. In holdout testing, the model predicted $0.70B versus actual $0.80B, a ~6% error, indicating usable out-of-sample accuracy. The latest quarterly revenue is $772M, and the FY forecast is $3.0B, up 5.1% year over year, portraying a modest growth outlook.
Investment Thesis
The econometric model achieves strong accuracy (5.6% MAPE), suggesting Revvity, Inc.'s revenue trajectory is well-characterized by its spending patterns. Every $1 of R&D investment is associated with $14.10 of revenue, indicating efficient capital deployment in innovation. Each $1 of SG&A spending generates $2.34 in revenue, reflecting strong commercial efficiency.
Revenue Forecast
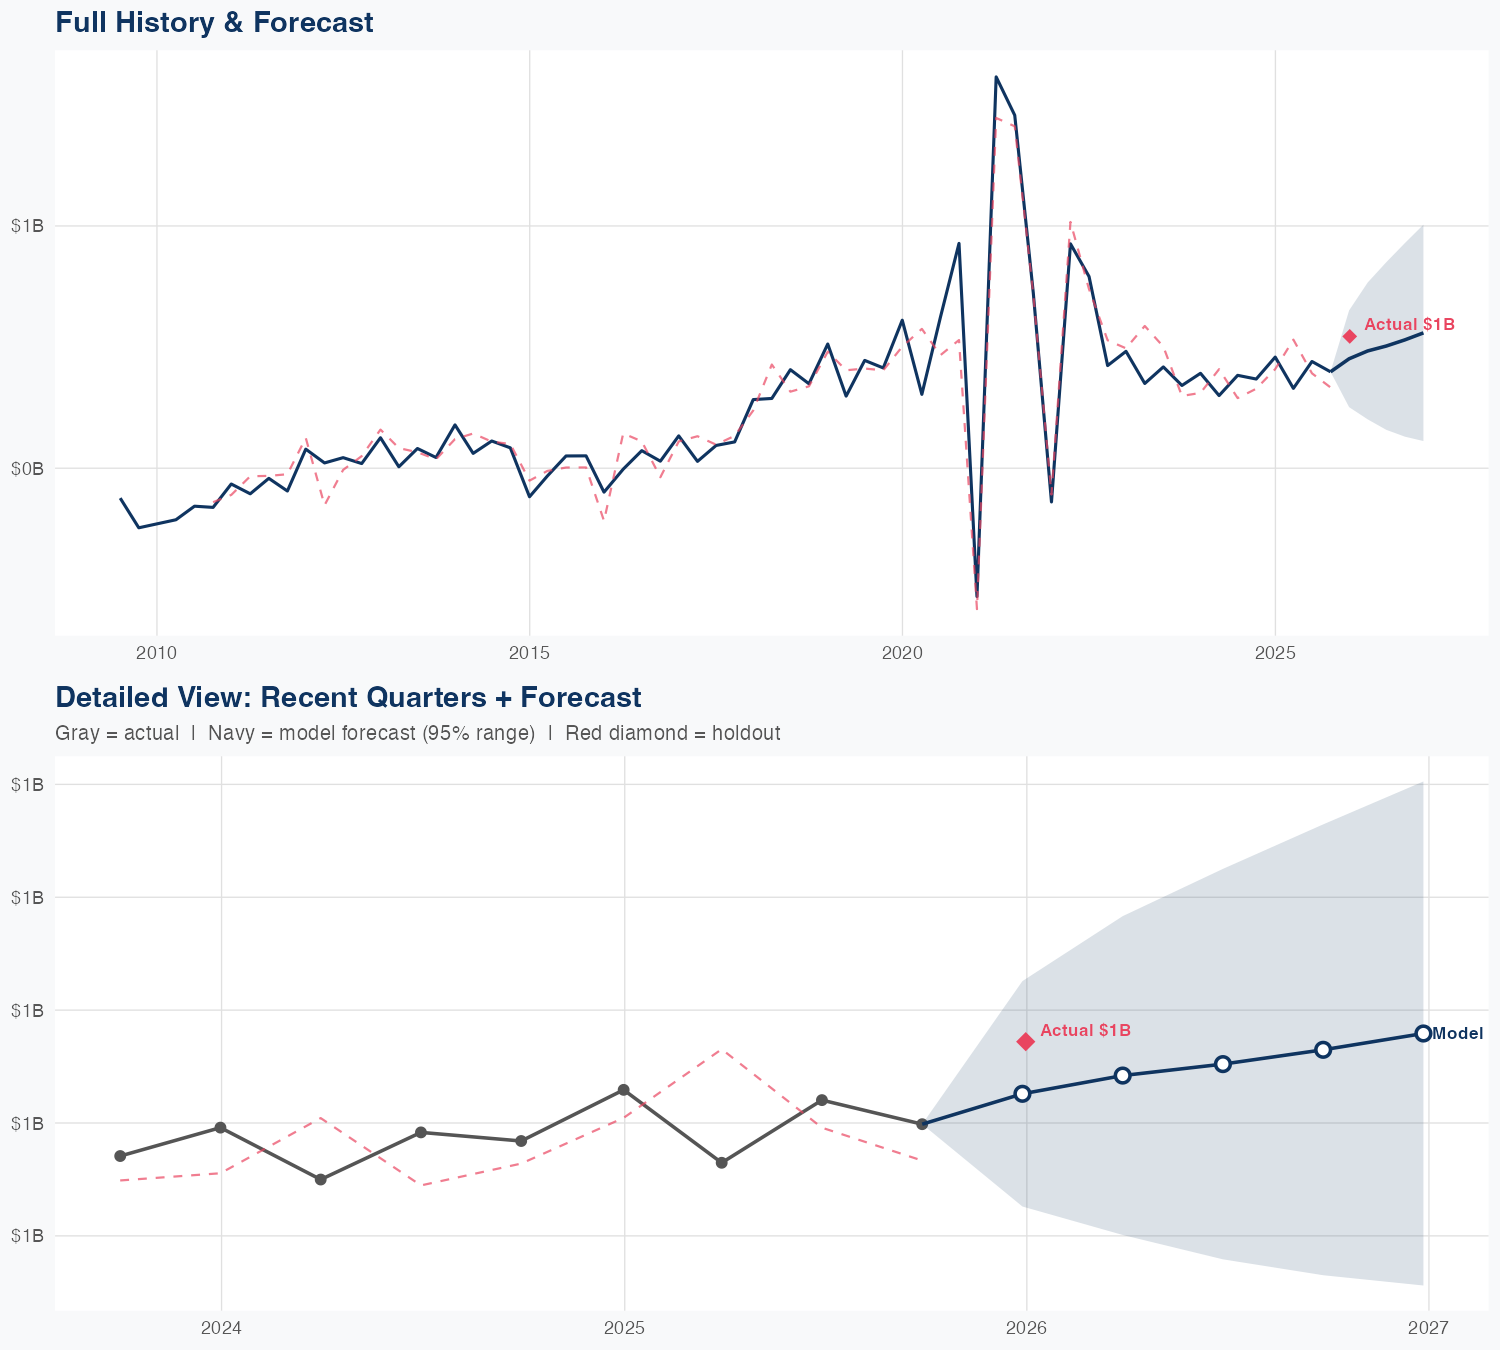
Quarterly Detail
| Quarter | Model Forecast | Actual | 95% Range | YoY Growth | Status |
|---|---|---|---|---|---|
| Q4 2025 | $0.7B | $0.8B | $0.6B – $0.8B | -0.5% | ✓ In range |
| Q1 2026 | $0.7B | $0.6B – $0.9B | +10.8% | ||
| Q2 2026 | $0.7B | $0.6B – $0.9B | +3.7% | ||
| Q3 2026 | $0.8B | $0.6B – $1.0B | +7.9% | ||
| Q4 2026 | $0.8B | $0.5B – $1.0B | -1.0% |
Seasonal Factors
| Fiscal Quarter | Seasonal Factor | vs Trend | Interpretation | Obs. |
|---|---|---|---|---|
| FQ1 (Sep–Nov) | 1.0018 | +0.2% | In line with trend | 16 |
| FQ2 (Dec–Feb) | 1.04 | +4.0% | +4.0% above trend | 16 |
| FQ3 (Mar–May) | 0.9321 | -6.8% | -6.8% below trend | 15 |
| FQ4 (Jun–Aug) | 1.0215 | +2.2% | In line with trend | 15 |
How Spending Drives Revenue
Want this analysis for your portfolio?
I build custom revenue intelligence reports for investors and companies using SEC filing data, econometric modeling, and AI-powered insights.
Get in Touch