The Sherwin-Williams Company SHW
Revenue Intelligence Report • 53 quarters of SEC filing data • Updated 2026-03-15
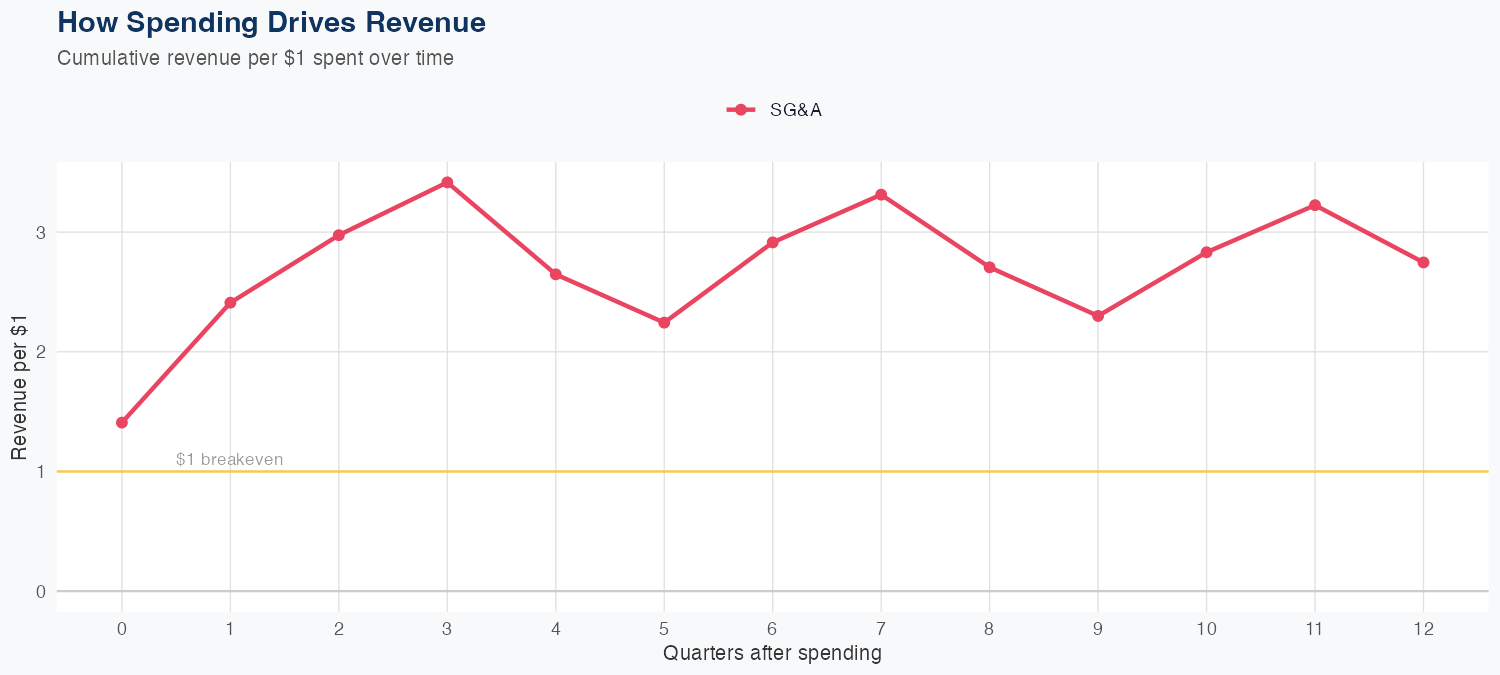
Revenue is driven in part by SG&A investments, which the model shows have a positive elasticity of 0.38% revenue per 1% SG&A, implying marketing and administrative spend contributes to topline growth. The revenue model uses a log-log specification over 53 quarters with an accuracy of 4.3% MAPE, and an out-of-sample holdout forecast of $6.3B versus $6.2B actual (about 2.9% error), supporting model reliability. Given the 0.38 elasticity, ROI on SG&A spending appears positive but modest, suggesting growth is driven by efficient deployment of SG&A rather than aggressive scaling. The full-year revenue forecast stands at about $26B, up 10.8% year over year, signaling a solid growth trajectory supported by disciplined spending and ongoing market demand.
Investment Thesis
The econometric model achieves strong accuracy (4.3% MAPE), suggesting The Sherwin-Williams Company's revenue trajectory is well-characterized by its spending patterns. Sales & marketing spend shows a 0.38x elasticity, suggesting effective go-to-market execution.
Revenue Forecast
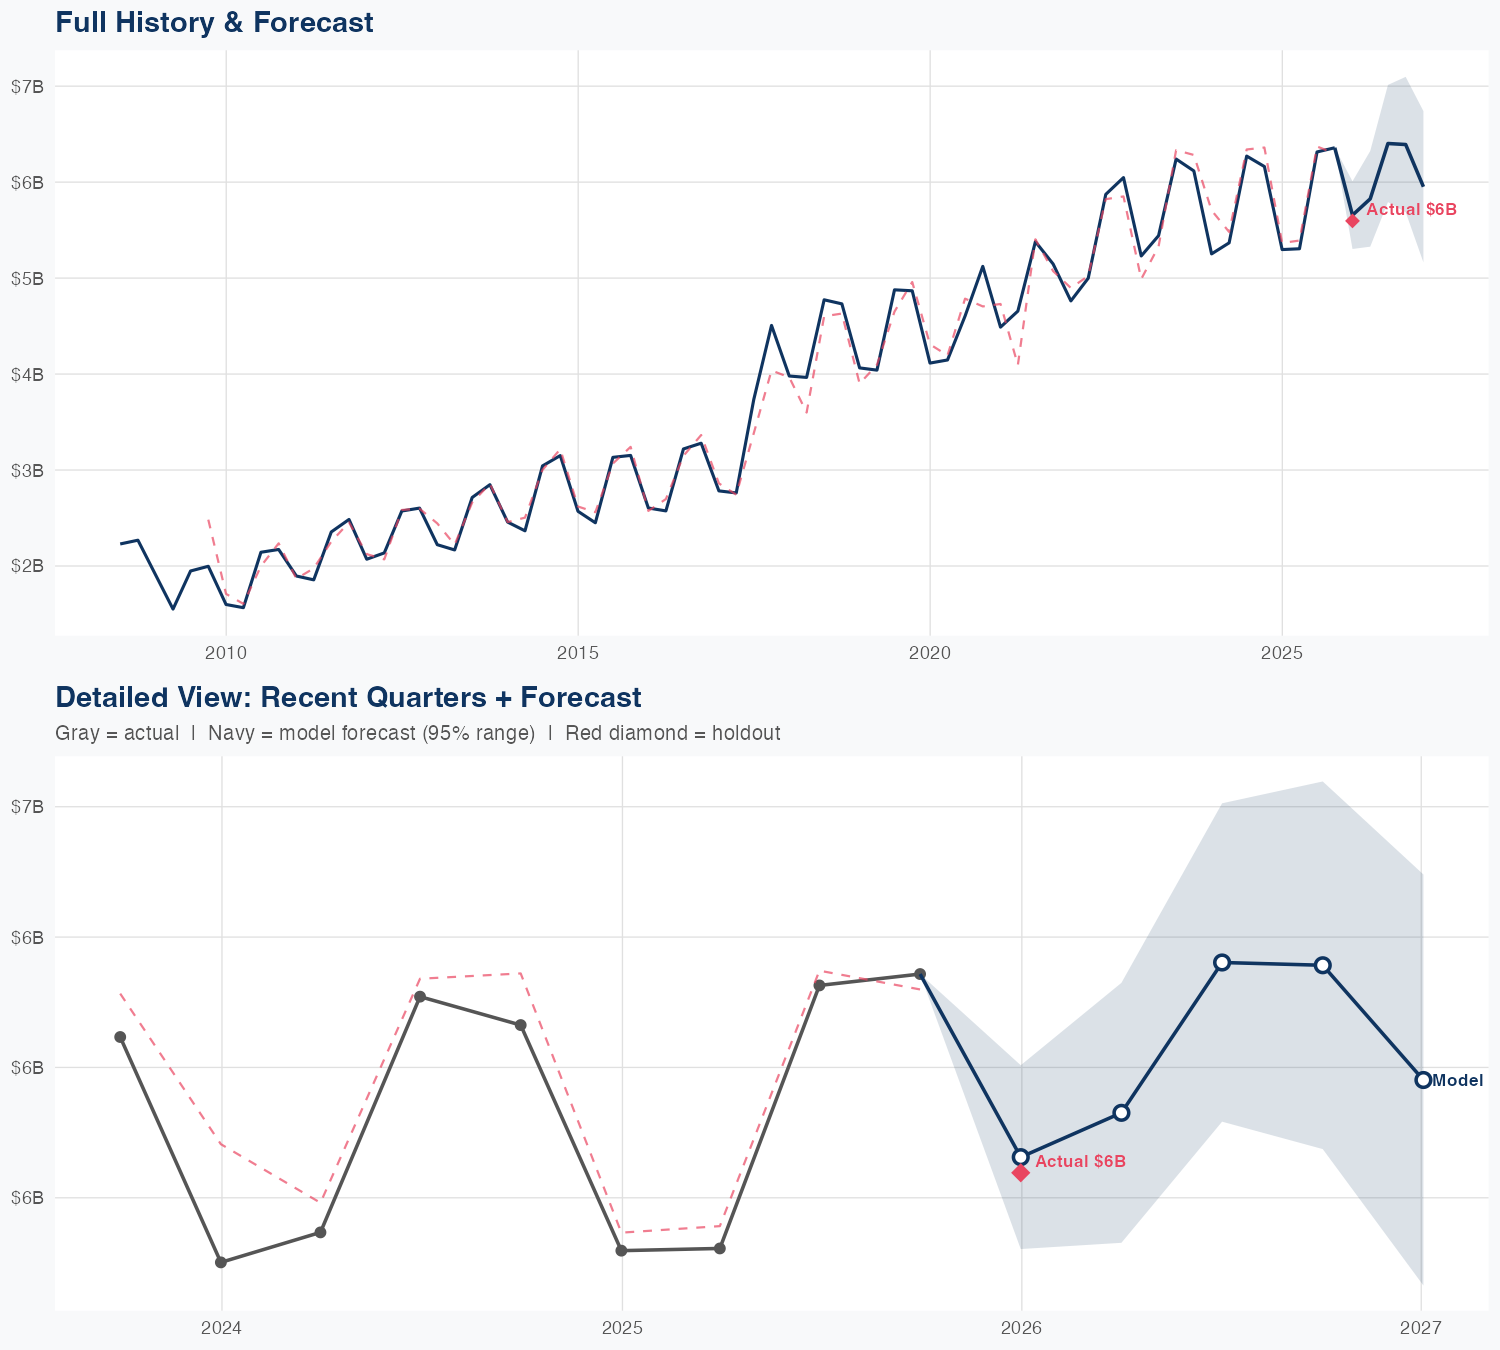
Quarterly Detail
| Quarter | Model Forecast | Actual | 95% Range | YoY Growth | Status |
|---|---|---|---|---|---|
| Q3 2024 | $6.3B | $6.2B | $5.7B – $7.1B | +3.6% | ✓ In range |
| Q4 2024 | $5.7B | $4.9B – $6.7B | +9.4% | ||
| Q2 2025 | $6.0B | $5.0B – $7.2B | +11.6% | ||
| Q3 2025 | $6.8B | $5.5B – $8.5B | +9.0% | ||
| Q4 2025 | $7.0B | $5.5B – $8.9B | +12.9% |
Seasonal Factors
| Fiscal Quarter | Seasonal Factor | vs Trend | Interpretation | Obs. |
|---|---|---|---|---|
| FQ1 (Sep–Nov) | 0.9716 | -2.8% | In line with trend | 13 |
| FQ2 (Dec–Feb) | 0.9805 | -1.9% | In line with trend | 12 |
| FQ3 (Mar–May) | 0.9772 | -2.3% | In line with trend | 12 |
| FQ4 (Jun–Aug) | 1.0169 | +1.7% | In line with trend | 12 |
How Spending Drives Revenue
Want this analysis for your portfolio?
I build custom revenue intelligence reports for investors and companies using SEC filing data, econometric modeling, and AI-powered insights.
Get in Touch