Constellation Brands, Inc. STZ
Revenue Intelligence Report • 27 quarters of SEC filing data • Updated 2026-03-15
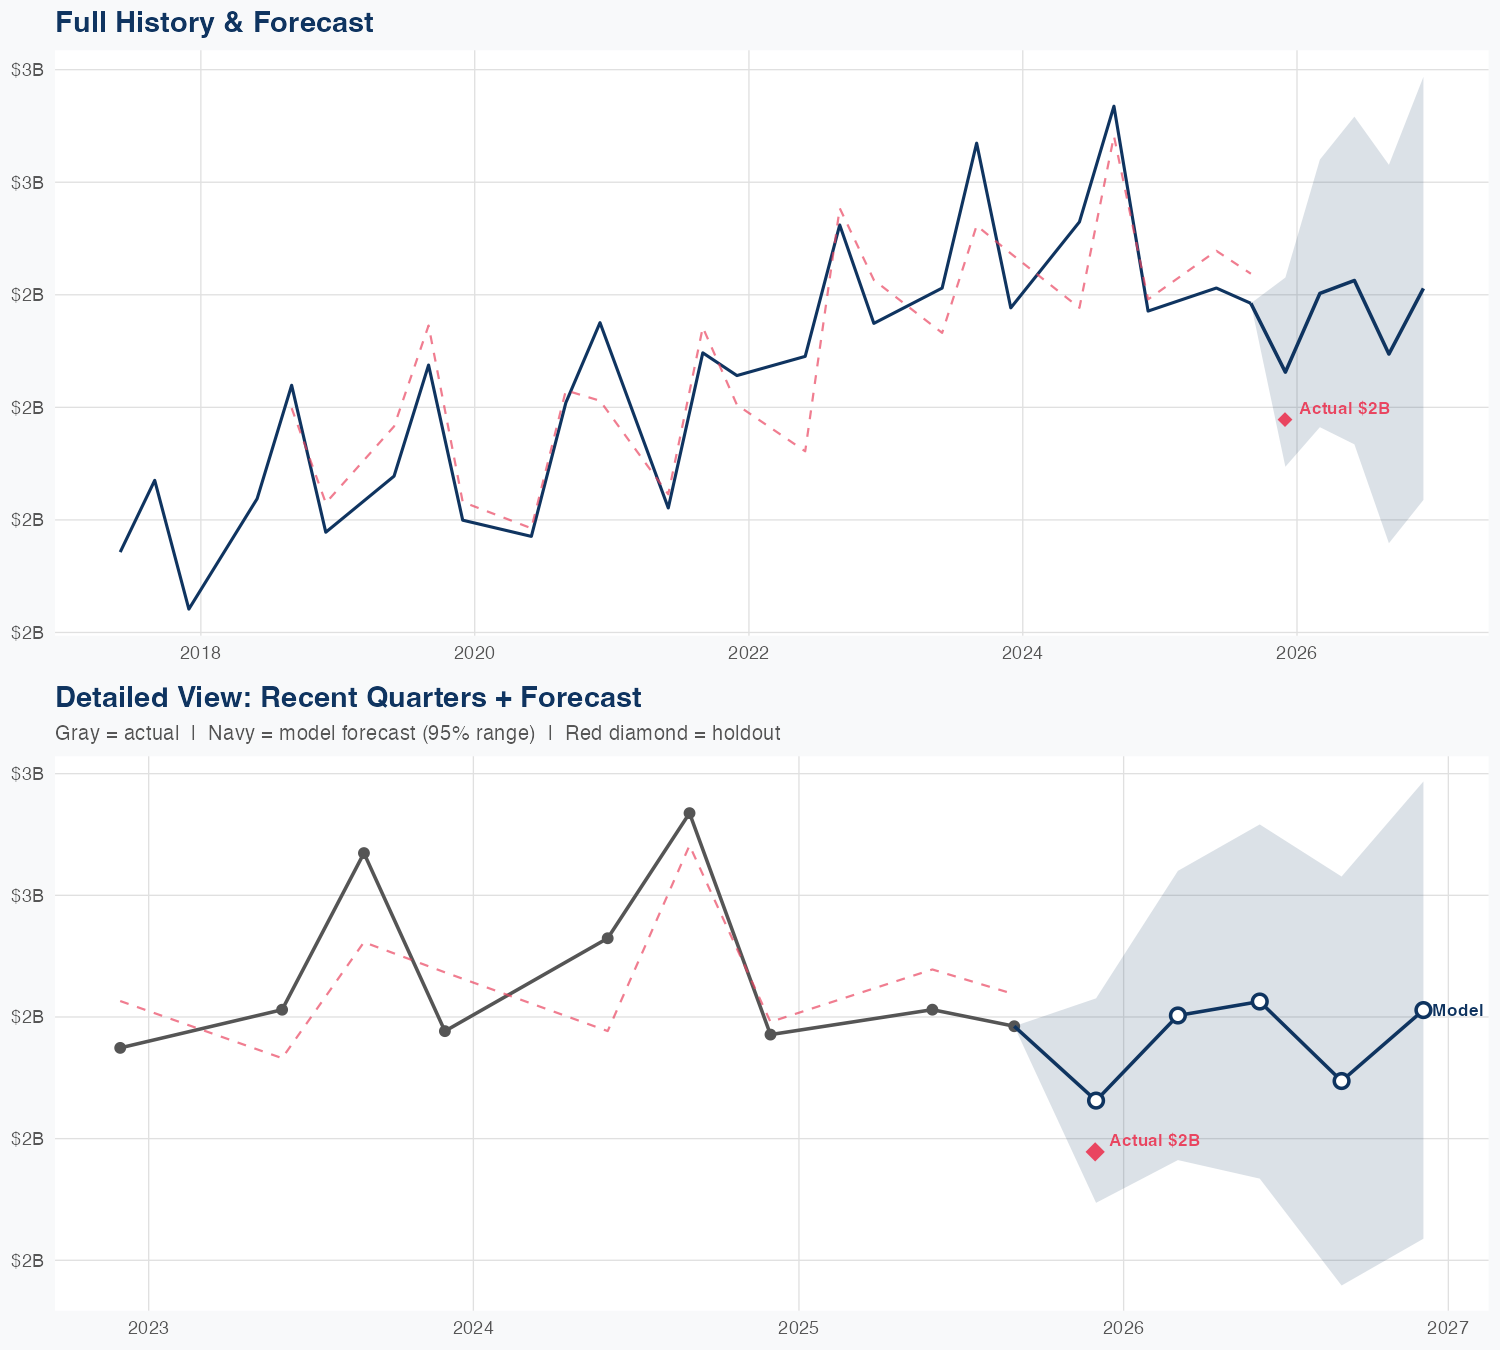
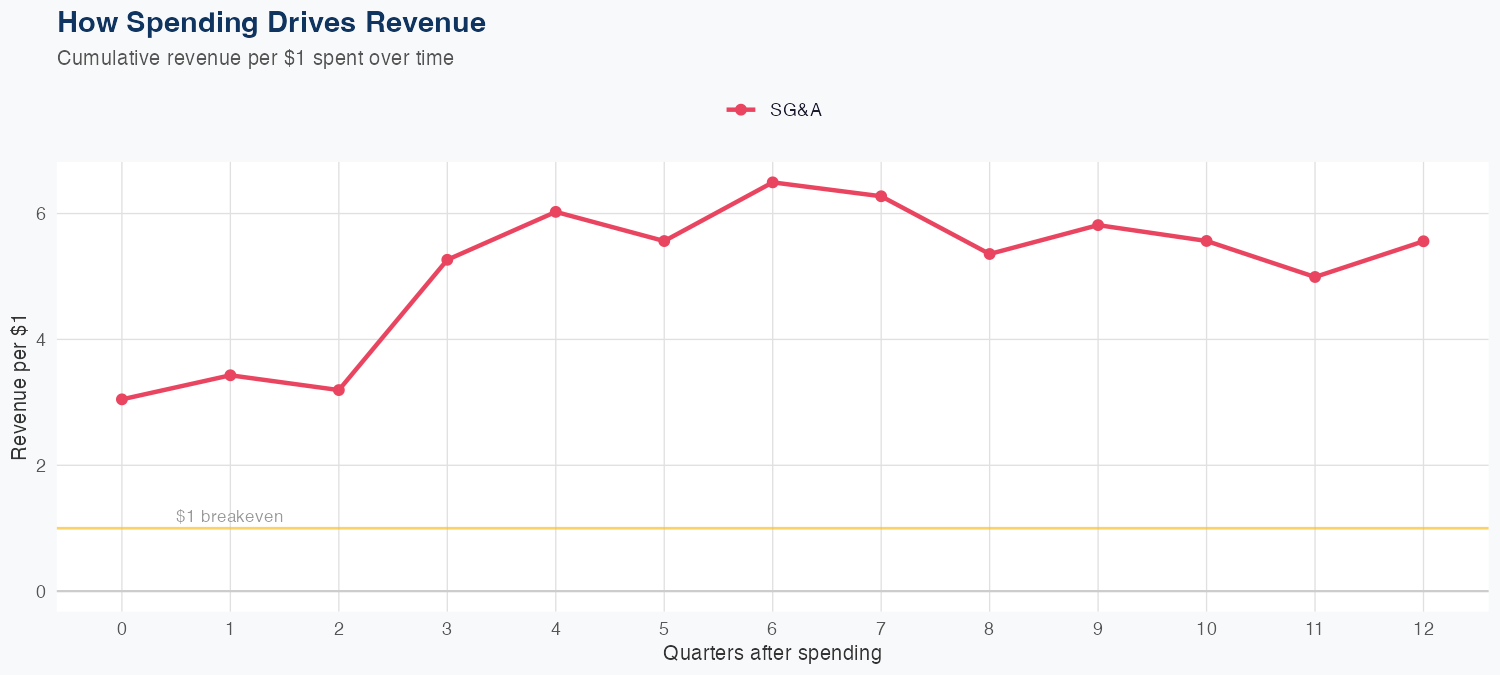
Revenue is driven by SG&A efficiency, with $1 of SG&A spending generating about $5.56 in long-run revenue, supported by 27 quarters of data and quarterly revenues around $2.223B. The linear model delivers 3.8% MAPE and, in holdout testing, predicted $2.3B versus actual $2.2B, a 4.7% error, indicating solid predictive accuracy of the revenue-SG&A relationship. The FY forecast calls for $9.9B in revenue, up about 2.4% year over year, signaling modest but steady top-line growth. Sustaining the SG&A ROI of roughly 5.56x implies attractive reinvestment dynamics, though the analysis notes the absence of R&D data in the model.
Investment Thesis
The econometric model achieves strong accuracy (3.8% MAPE), suggesting Constellation Brands, Inc.'s revenue trajectory is well-characterized by its spending patterns. Each $1 of SG&A spending generates $5.56 in revenue, reflecting strong commercial efficiency.
Revenue Forecast
Quarterly Detail
| Quarter | Model Forecast | Actual | 95% Range | YoY Growth | Status |
|---|---|---|---|---|---|
| Q4 2025 | $2.3B | $2.2B | $2.1B – $2.5B | -20.2% | ✓ In range |
| Q1 2026 | $2.5B | $2.2B – $2.8B | +1.6% | ||
| Q2 2026 | $2.5B | $2.2B – $2.9B | +0.7% | ||
| Q3 2026 | $2.4B | $1.9B – $2.8B | -4.5% | ||
| Q4 2026 | $2.5B | $2.0B – $3.0B | +13.1% |
Seasonal Factors
| Fiscal Quarter | Seasonal Factor | vs Trend | Interpretation | Obs. |
|---|---|---|---|---|
| FQ1 (Sep–Nov) | 0.9802 | -2.0% | In line with trend | 8 |
| FQ2 (Dec–Feb) | 1.0 | +0.0% | In line with trend | 0 |
| FQ3 (Mar–May) | 0.9909 | -0.9% | In line with trend | 7 |
| FQ4 (Jun–Aug) | 0.9881 | -1.2% | In line with trend | 8 |
How Spending Drives Revenue
Want this analysis for your portfolio?
I build custom revenue intelligence reports for investors and companies using SEC filing data, econometric modeling, and AI-powered insights.
Get in Touch