Smurfit Westrock Plc SW
Revenue Intelligence Report • 9 quarters of SEC filing data • Updated 2026-03-07
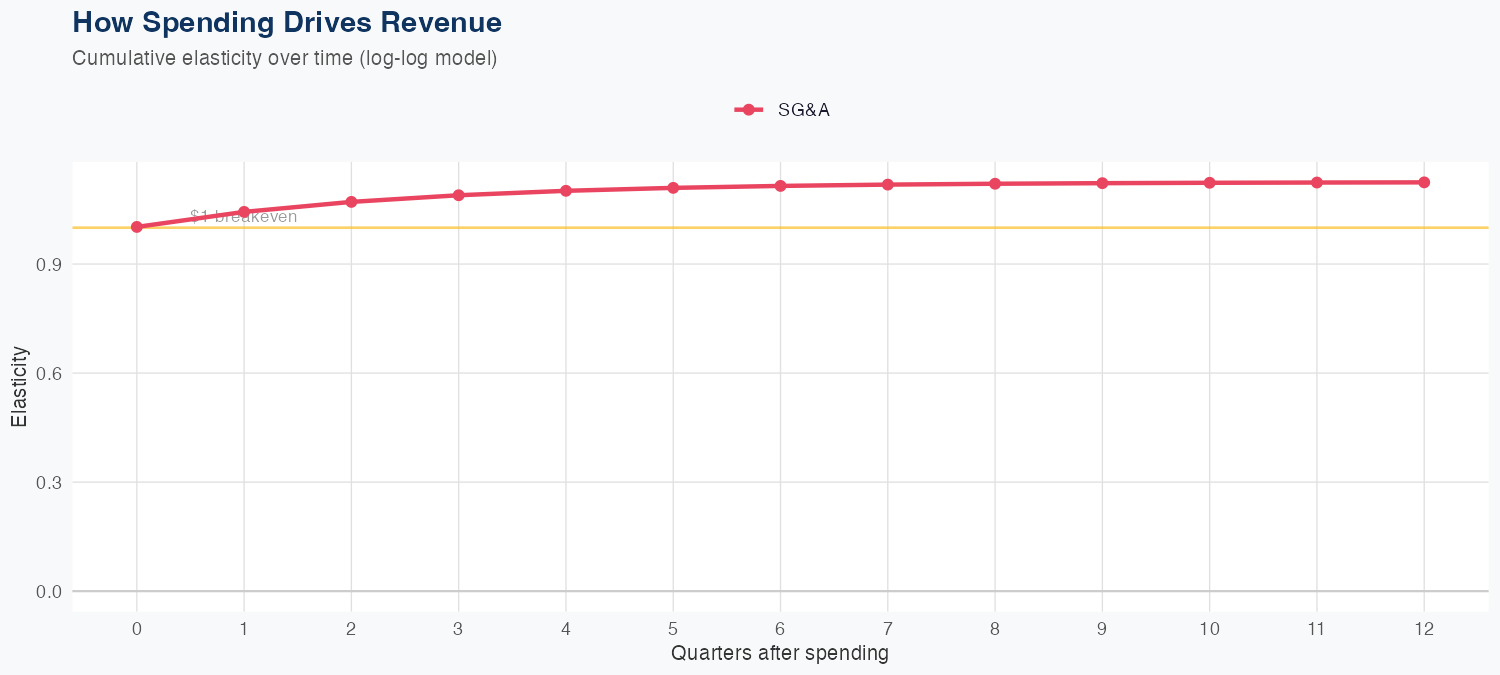
The company's revenue growth is primarily driven by its strategic investments in selling, general, and administrative expenses, which have demonstrated a strong elasticity of 1.12% in revenue for every 1% increase in SG&A. Despite a recent holdout test revealing a significant discrepancy between predicted and actual revenues, the model's accuracy remains solid at 1.0% MAPE, indicating reliable forecasting potential. Looking ahead, the company is projecting a remarkable $80 billion in revenue for the fiscal year, reflecting a 155.1% year-over-year increase, signaling meaningful growth prospects for investors. Overall, the focus on optimizing SG&A spending presents a compelling revenue efficiency and positions the company favorably for future expansion.
Investment Thesis
Our ARDL model tracks Smurfit Westrock Plc's revenue with exceptional precision (1.0% MAPE), indicating highly predictable cash flows. Sales & marketing spend shows a 1.12x elasticity, suggesting effective go-to-market execution.
Revenue Forecast
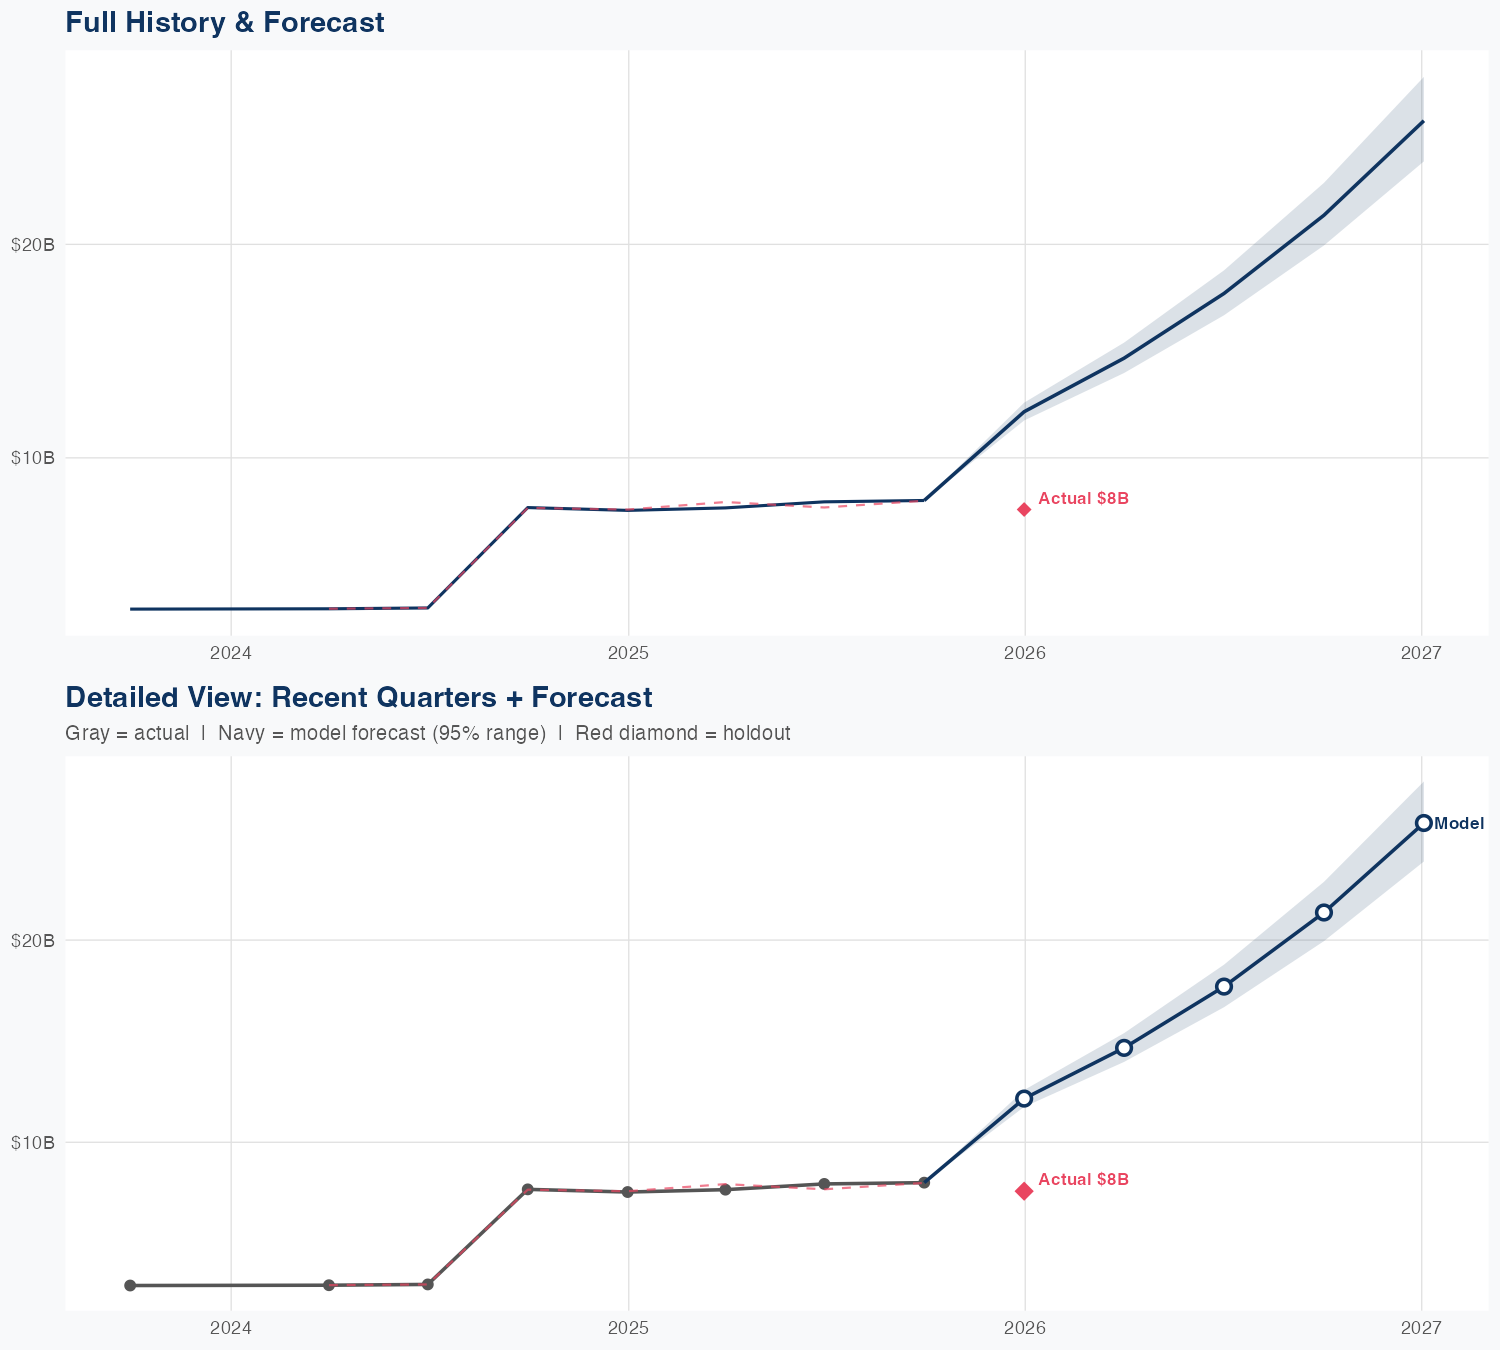
Quarterly Detail
| Quarter | Model Forecast | Actual | 95% Range | YoY Growth | Status |
|---|---|---|---|---|---|
| Q4 2025 | $12B | $7.6B | $12B – $13B | +61.3% | ✗ Outside range |
| Q2 2026 | $15B | $14B – $15B | +91.6% | ||
| Q3 2026 | $18B | $17B – $19B | +122.9% | ||
| Q4 2026 | $21B | $20B – $23B | +167.0% | ||
| Q1 2027 | $26B | $24B – $28B | +240.3% |
How Spending Drives Revenue
Want this analysis for your portfolio?
I build custom revenue intelligence reports for investors and companies using SEC filing data, econometric modeling, and AI-powered insights.
Get in Touch