Stryker Corp SYK
Revenue Intelligence Report • 70 quarters of SEC filing data • Updated 2026-03-15
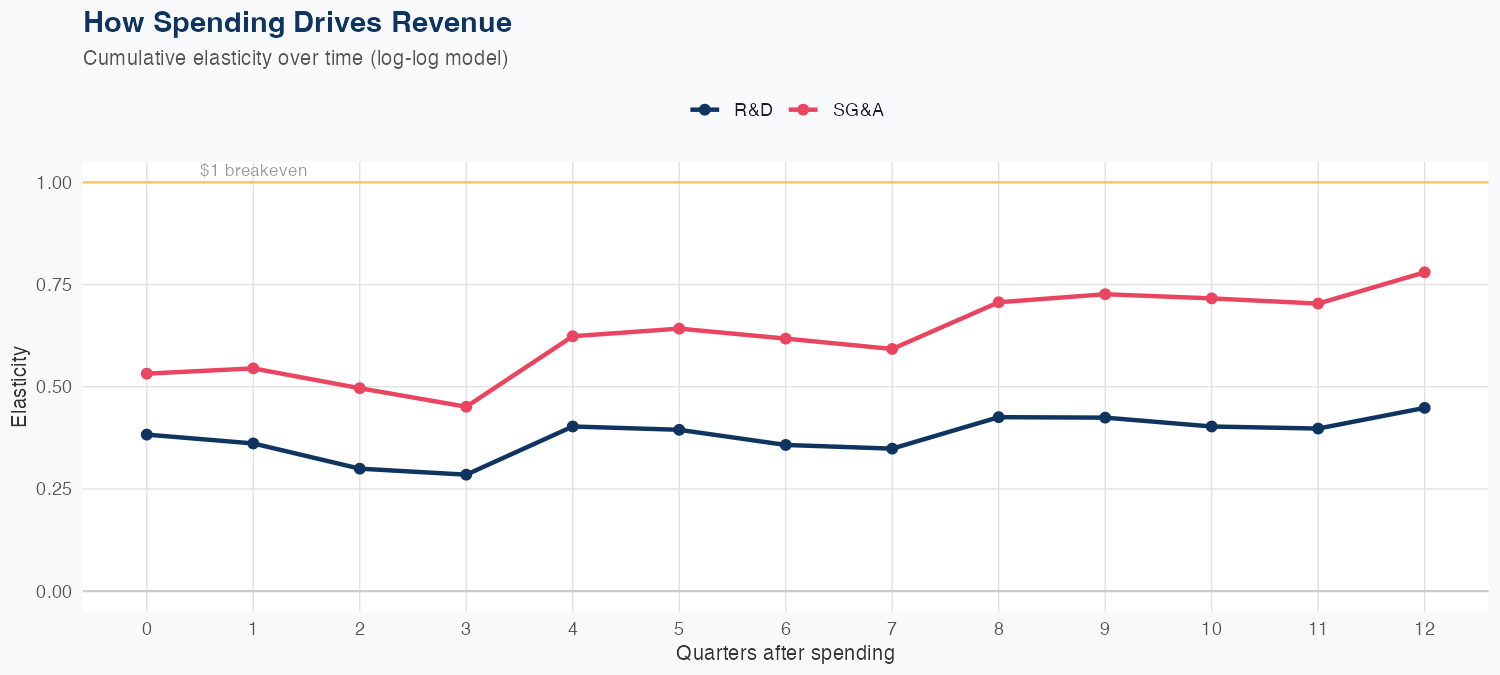
Revenue growth is driven by a combination of product demand and spending efficiency, with SG&A delivering a higher revenue elasticity (0.78% per 1% increase) than R&D (0.45% per 1% increase) in a log-log model built on 70 quarters of data. The model shows reasonably accurate forecasting, with a 3.8% MAPE and a holdout error of 5.3% (predicted 6.8B vs actual 7.2B), indicating useful but imperfect quarterly predictability. The FY outlook projects about $27B in revenue, up roughly 7.5% year over year, signaling a constructive growth path supported by durable product demand and efficient expense translation. For investors, ROI appears more favorable from SG&A investments driving near-term revenue uplift, while preserving R&D productivity remains important to sustain longer-term, competitive growth.
Investment Thesis
The econometric model achieves strong accuracy (3.8% MAPE), suggesting Stryker Corp's revenue trajectory is well-characterized by its spending patterns. R&D investment shows a 0.45x multiplier — each 1% increase in R&D spend is associated with a 0.45% revenue increase, signaling strong innovation-to-revenue conversion. Sales & marketing spend shows a 0.78x elasticity, suggesting effective go-to-market execution.
Revenue Forecast
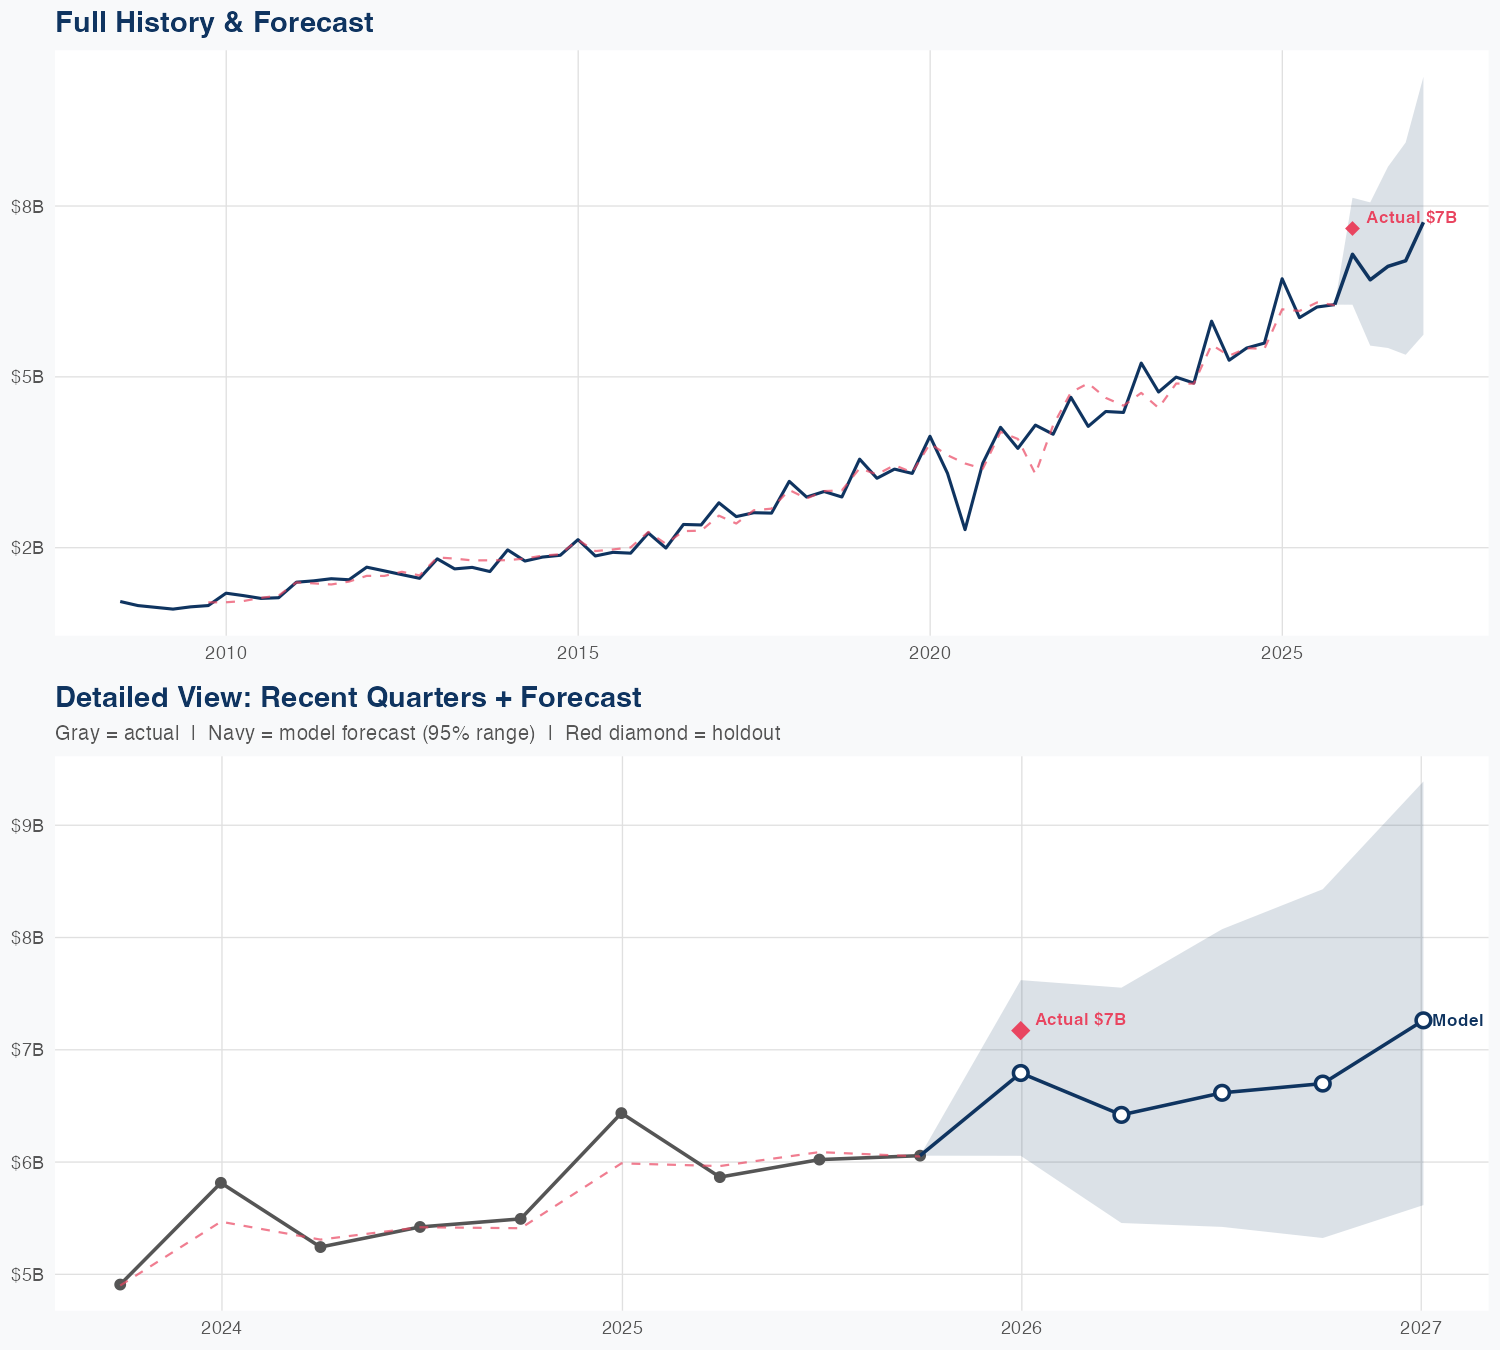
Quarterly Detail
| Quarter | Model Forecast | Actual | 95% Range | YoY Growth | Status |
|---|---|---|---|---|---|
| Q4 2025 | $6.8B | $7.2B | $6.1B – $7.6B | +5.6% | ✓ In range |
| Q2 2026 | $6.4B | $5.5B – $7.6B | +9.4% | ||
| Q3 2026 | $6.6B | $5.4B – $8.1B | +9.9% | ||
| Q4 2026 | $6.7B | $5.3B – $8.4B | +10.6% | ||
| Q1 2027 | $7.3B | $5.6B – $9.4B | +1.3% |
Seasonal Factors
| Fiscal Quarter | Seasonal Factor | vs Trend | Interpretation | Obs. |
|---|---|---|---|---|
| FQ1 (Sep–Nov) | 0.9826 | -1.7% | In line with trend | 17 |
| FQ2 (Dec–Feb) | 1.0379 | +3.8% | +3.8% above trend | 17 |
| FQ3 (Mar–May) | 0.9845 | -1.5% | In line with trend | 16 |
| FQ4 (Jun–Aug) | 0.9912 | -0.9% | In line with trend | 16 |
How Spending Drives Revenue
Want this analysis for your portfolio?
I build custom revenue intelligence reports for investors and companies using SEC filing data, econometric modeling, and AI-powered insights.
Get in Touch