At&t Inc. T
Revenue Intelligence Report • 70 quarters of SEC filing data • Updated 2026-03-15
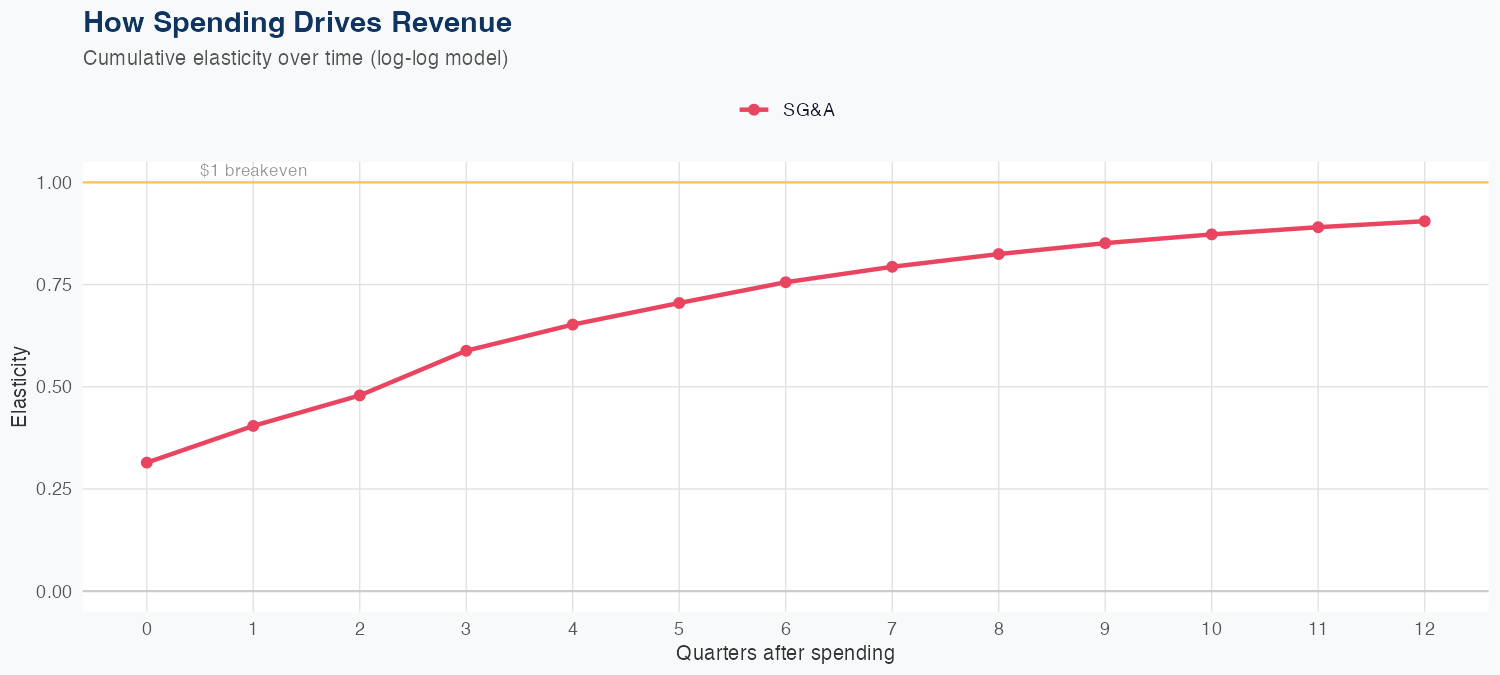
AT&T’s FY revenue of $122B fell 3.3% YoY, and our econometric model shows SG&A elasticity of 0.91x, meaning SG&A spend moves revenue nearly proportionally. With the topline shrinking, this suggests SG&A is a near-term growth lever, but it isn’t delivering topline growth on its own—any rebound would likely require favorable pricing/mix or subscriber gains beyond just higher selling/admin spend. The holdout miss—predicted $30.5B vs actual $33.5B, an 8.9% error—highlights modest forecast reliability and potential model misspecification around the latest dynamics. While a 5.9% MAPE is reasonable, the growth-rate risk remains outsized given the telecom’s heavy fixed-cost base and ongoing capex for 5G/fiber, which could amplify margin pressure if revenue doesn’t recover.
Investment Thesis
The econometric model achieves strong accuracy (5.9% MAPE), suggesting At&t Inc.'s revenue trajectory is well-characterized by its spending patterns. Sales & marketing spend shows a 0.91x elasticity, suggesting effective go-to-market execution.
Revenue Forecast
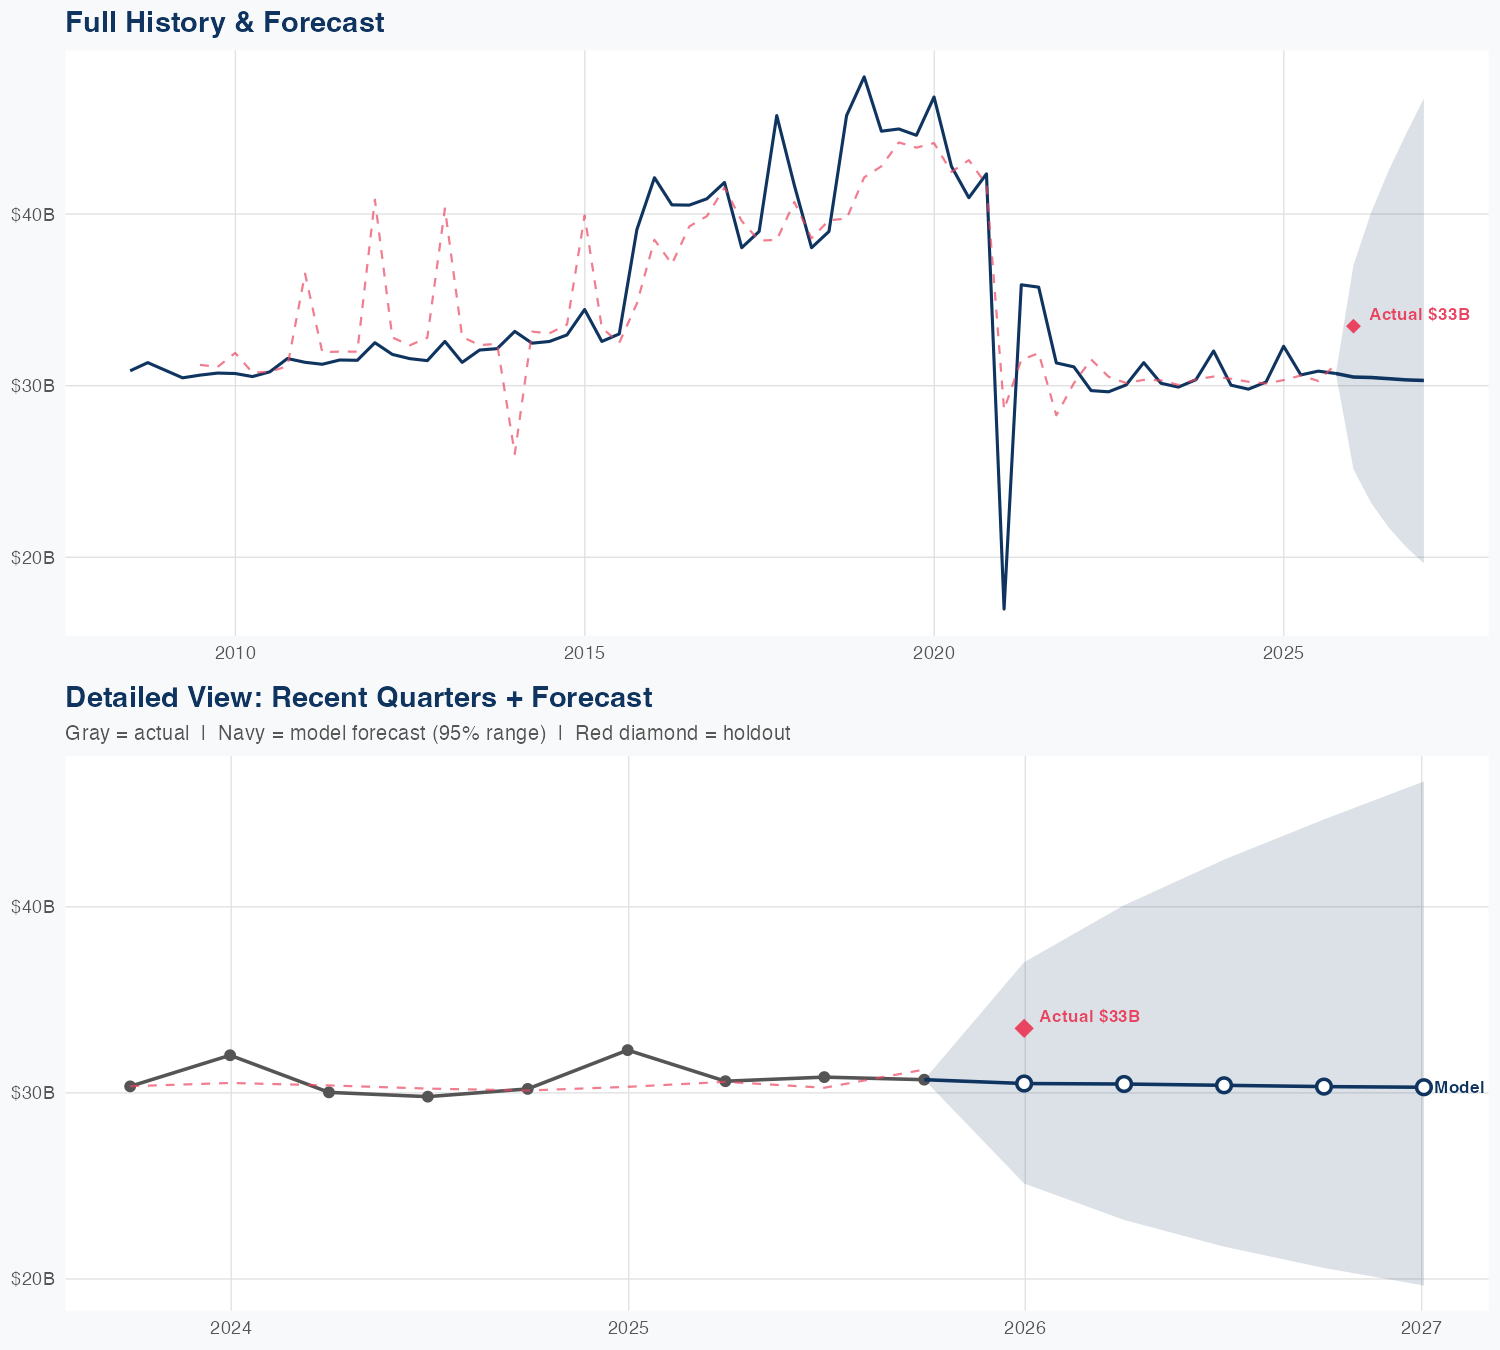
Quarterly Detail
| Quarter | Model Forecast | Actual | 95% Range | YoY Growth | Status |
|---|---|---|---|---|---|
| Q4 2025 | $31B | $33B | $25B – $37B | -5.6% | ✓ In range |
| Q2 2026 | $30B | $23B – $40B | -0.5% | ||
| Q3 2026 | $30B | $22B – $43B | -1.4% | ||
| Q4 2026 | $30B | $21B – $45B | -1.2% | ||
| Q1 2027 | $30B | $20B – $47B | -9.5% |
Seasonal Factors
| Fiscal Quarter | Seasonal Factor | vs Trend | Interpretation | Obs. |
|---|---|---|---|---|
| FQ1 (Sep–Nov) | 1.0029 | +0.3% | In line with trend | 17 |
| FQ2 (Dec–Feb) | 1.0315 | +3.2% | +3.2% above trend | 17 |
| FQ3 (Mar–May) | 0.9877 | -1.2% | In line with trend | 16 |
| FQ4 (Jun–Aug) | 0.991 | -0.9% | In line with trend | 17 |
How Spending Drives Revenue
Want this analysis for your portfolio?
I build custom revenue intelligence reports for investors and companies using SEC filing data, econometric modeling, and AI-powered insights.
Get in Touch