Te Connectivity Plc TEL
Revenue Intelligence Report • 53 quarters of SEC filing data • Updated 2026-03-15
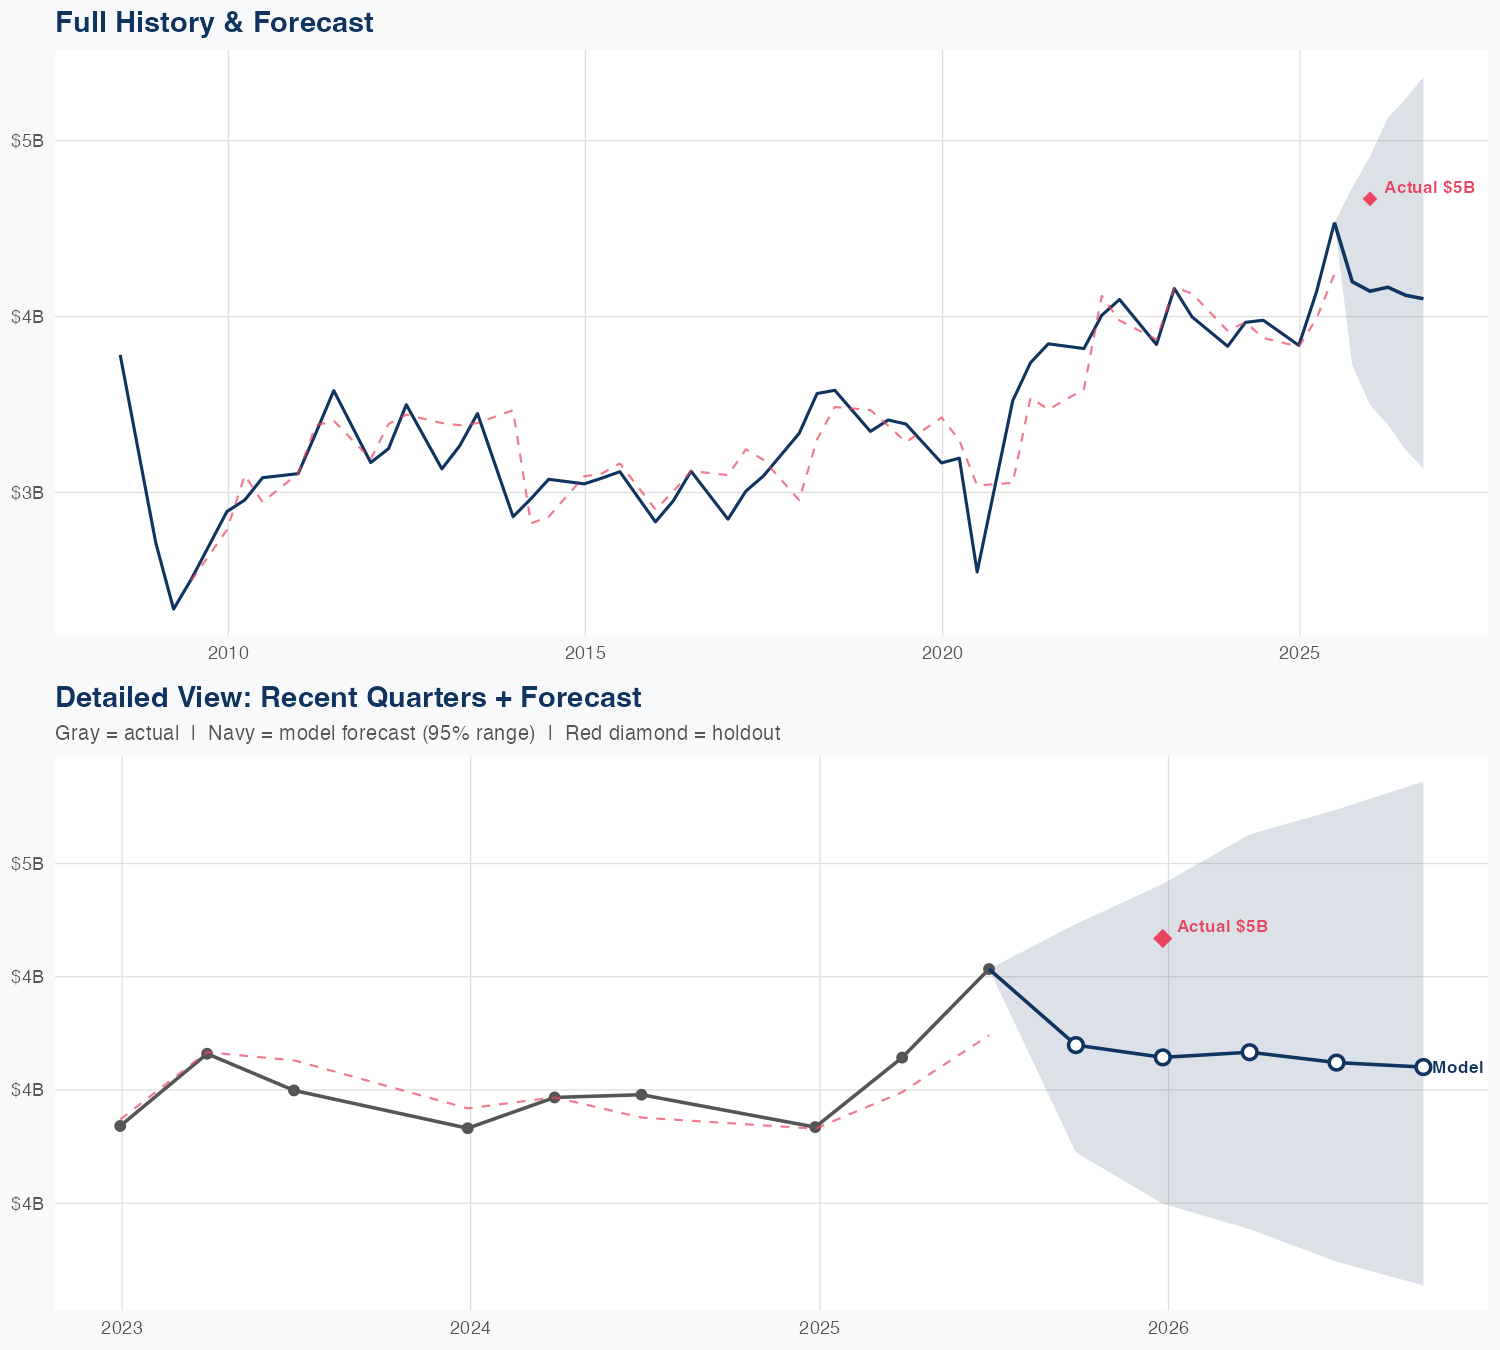
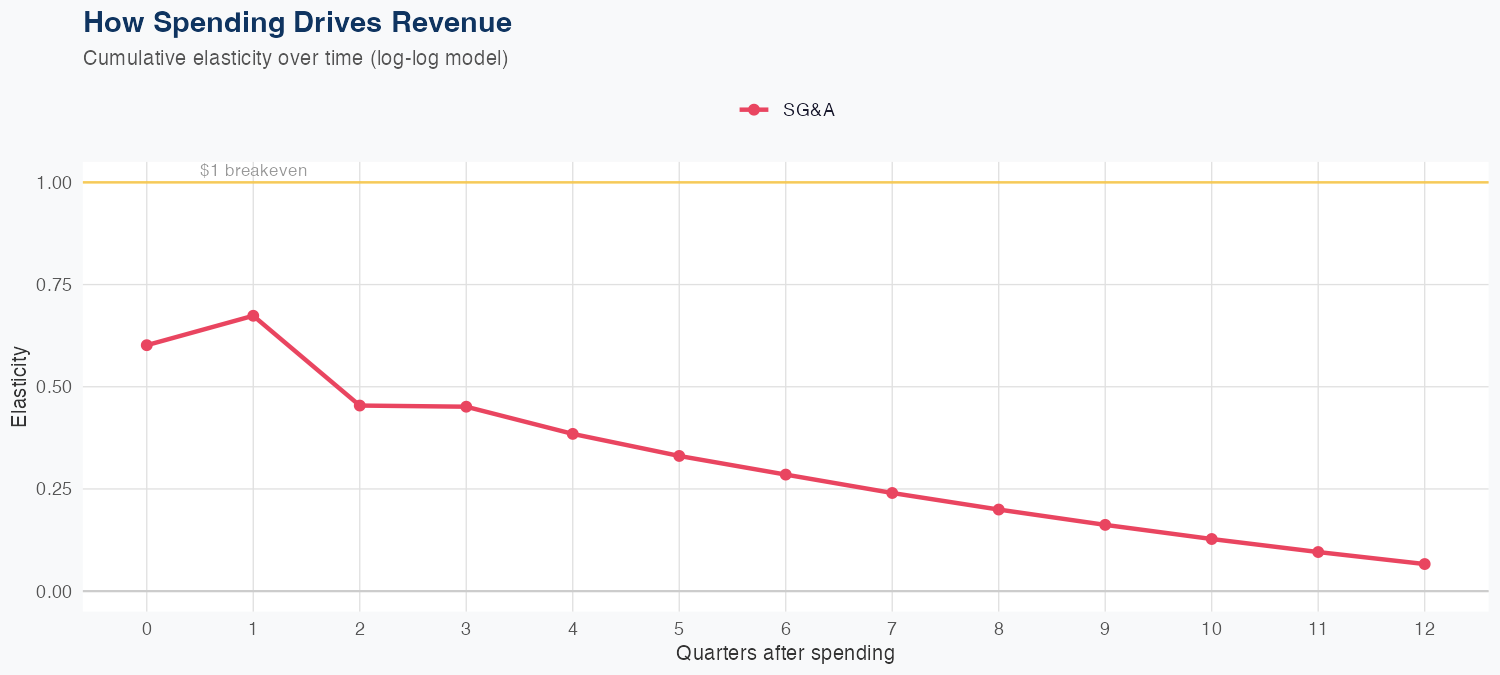
Revenue is driven modestly by SG&A spending, with an elasticity of about 0.07% increase in revenue per 1% SG&A rise, indicating a low but positive impact from SG&A in a log-log framework. The model uses 53 quarters of data and achieves 4.4% MAPE, though holdout testing shows predicting 4.2B vs 4.7B actual (about 10% error), signaling reasonable but imperfect near-term accuracy. The FY forecast implies approximately $17B in revenue, down 3.8% year over year, pointing to near-term headwinds and limited organic growth drivers. Given the modest SG&A elasticity, ROI on SG&A spending appears constrained, suggesting meaningful upside would require efficiency gains or the emergence of other revenue drivers beyond SG&A.
Investment Thesis
The econometric model achieves strong accuracy (4.4% MAPE), suggesting Te Connectivity Plc's revenue trajectory is well-characterized by its spending patterns. Sales & marketing spend shows a 0.07x elasticity, suggesting effective go-to-market execution.
Revenue Forecast
Quarterly Detail
| Quarter | Model Forecast | Actual | 95% Range | YoY Growth | Status |
|---|---|---|---|---|---|
| Q3 2025 | $4.2B | $4.7B | $3.7B – $4.7B | +5.5% | ✓ In range |
| Q4 2025 | $4.1B | $3.5B – $4.9B | +8.0% | ||
| Q1 2026 | $4.2B | $3.4B – $5.1B | +0.6% | ||
| Q2 2026 | $4.1B | $3.2B – $5.2B | -9.1% | ||
| Q3 2026 | $4.1B | $3.1B – $5.4B | -12.2% |
Seasonal Factors
| Fiscal Quarter | Seasonal Factor | vs Trend | Interpretation | Obs. |
|---|---|---|---|---|
| FQ1 (Sep–Nov) | 1.0 | +0.0% | In line with trend | 0 |
| FQ2 (Dec–Feb) | 0.9926 | -0.7% | In line with trend | 17 |
| FQ3 (Mar–May) | 0.9916 | -0.8% | In line with trend | 16 |
| FQ4 (Jun–Aug) | 1.026 | +2.6% | In line with trend | 17 |
How Spending Drives Revenue
Want this analysis for your portfolio?
I build custom revenue intelligence reports for investors and companies using SEC filing data, econometric modeling, and AI-powered insights.
Get in Touch