The Travelers Companies, Inc. TRV
Revenue Intelligence Report • 29 quarters of SEC filing data • Updated 2026-03-15
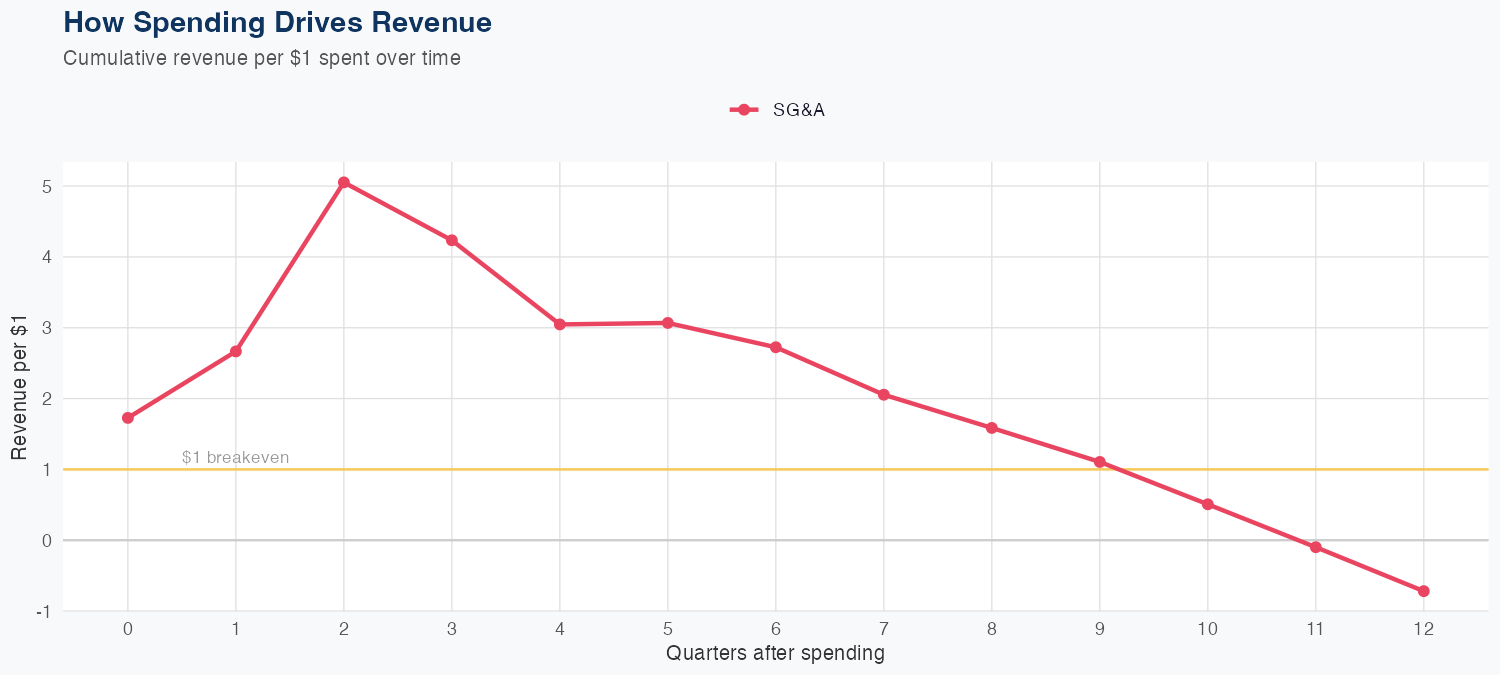
Revenue is driven by SG&A efficiency, with $1 of SG&A spending generating $3.34 in long-run revenue, signaling a strong ROI on selling and admin investments. The modeling is a linear framework built on 29 quarterly observations, achieving 1.4% MAPE and a holdout error of -1.8% (predicted 6.9B vs actual 6.8B). The FY revenue forecast stands at $28B, up 4.0% year over year, indicating continued growth from the same efficiency-driven revenue engine. With clear SG&A ROI and a steady growth trajectory, the outlook is constructive for investors, though the absence of R&D data adds some uncertainty regarding innovation-driven upside.
Investment Thesis
Our ARDL model tracks The Travelers Companies, Inc.'s revenue with exceptional precision (1.4% MAPE), indicating highly predictable cash flows. Each $1 of SG&A spending generates $3.34 in revenue, reflecting strong commercial efficiency.
Revenue Forecast
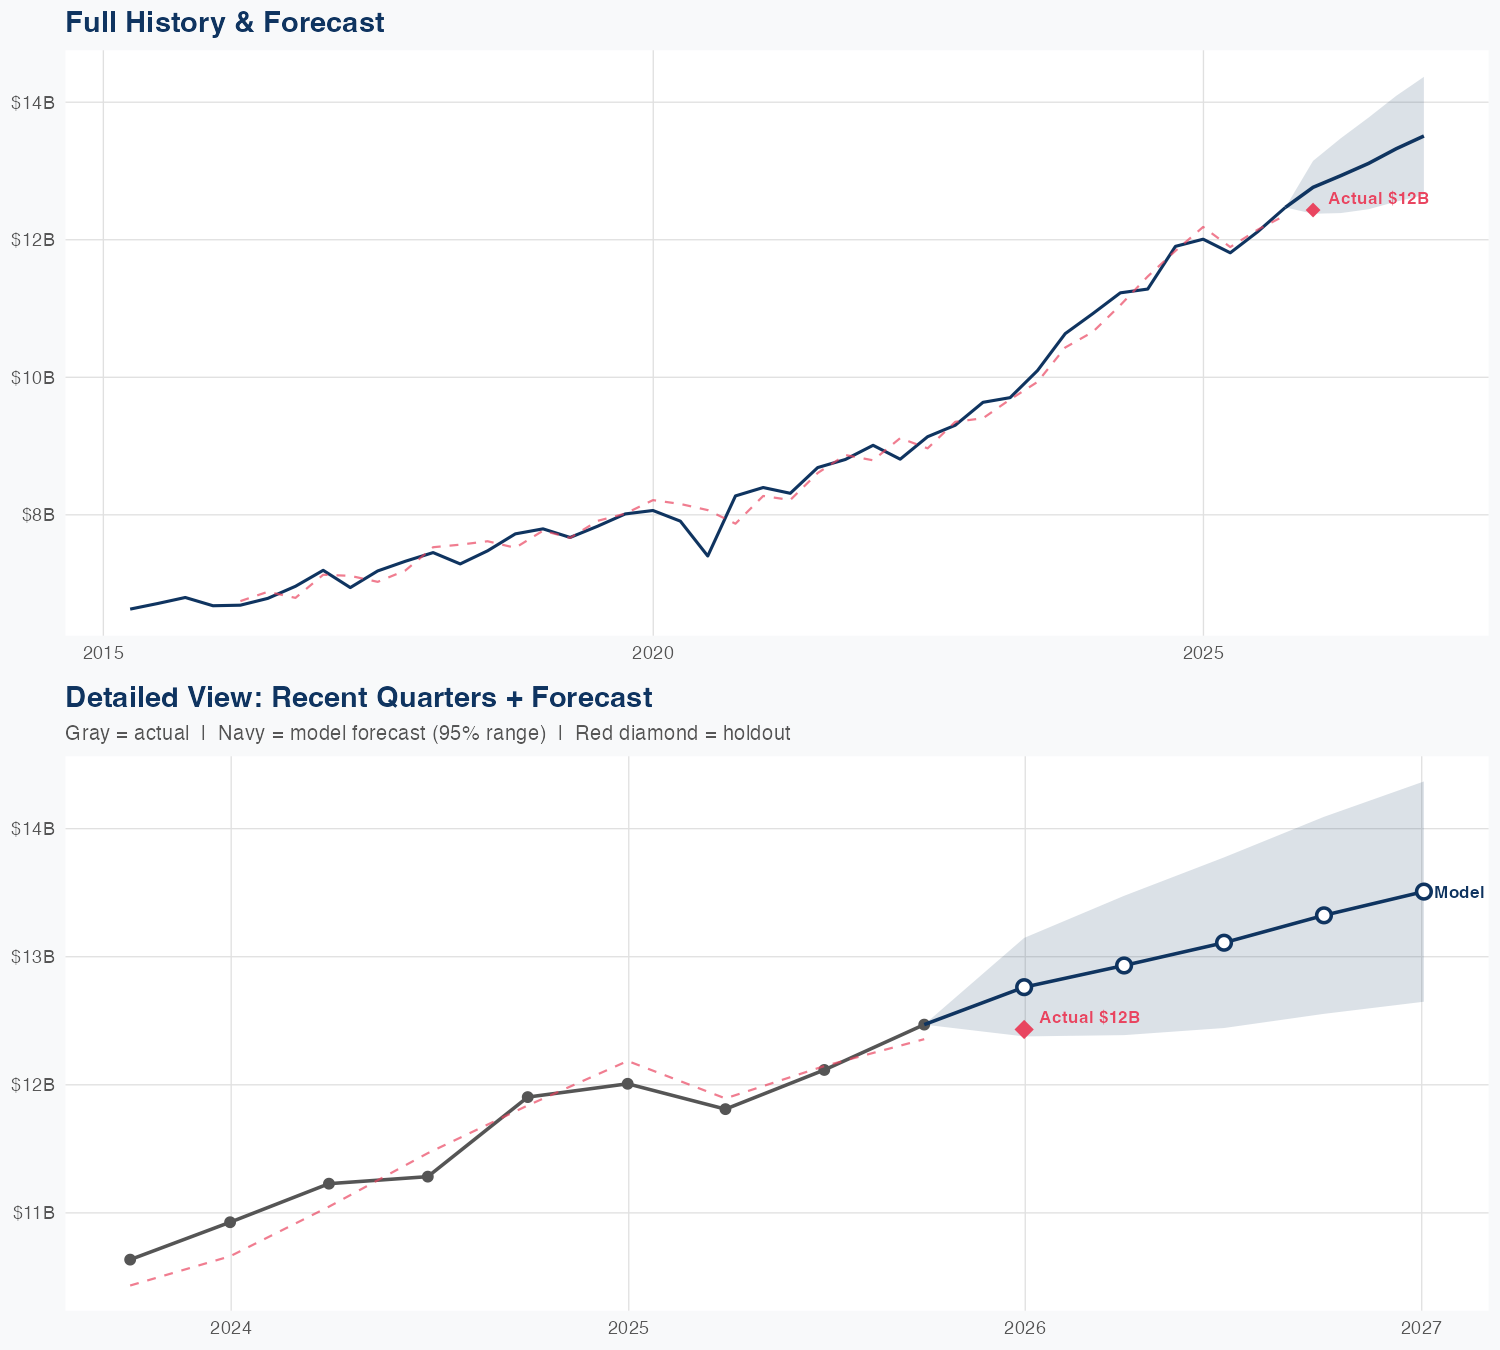
Quarterly Detail
| Quarter | Model Forecast | Actual | 95% Range | YoY Growth | Status |
|---|---|---|---|---|---|
| Q3 2015 | $6.9B | $6.8B | $6.7B – $7.1B | +0.5% | ✓ In range |
| Q4 2015 | $7.0B | $6.7B – $7.2B | +2.7% | ||
| Q2 2016 | $6.9B | $6.6B – $7.3B | +4.8% | ||
| Q3 2016 | $7.0B | $6.6B – $7.4B | +4.5% | ||
| Q4 2016 | $7.1B | $6.6B – $7.5B | +4.1% |
Seasonal Factors
| Fiscal Quarter | Seasonal Factor | vs Trend | Interpretation | Obs. |
|---|---|---|---|---|
| FQ1 (Sep–Nov) | 1.0123 | +1.2% | In line with trend | 7 |
| FQ2 (Dec–Feb) | 0.9939 | -0.6% | In line with trend | 6 |
| FQ3 (Mar–May) | 0.9955 | -0.5% | In line with trend | 6 |
| FQ4 (Jun–Aug) | 1.0042 | +0.4% | In line with trend | 6 |
How Spending Drives Revenue
Want this analysis for your portfolio?
I build custom revenue intelligence reports for investors and companies using SEC filing data, econometric modeling, and AI-powered insights.
Get in Touch