Tractor Supply Co /De/ TSCO
Revenue Intelligence Report • 31 quarters of SEC filing data • Updated 2026-03-15
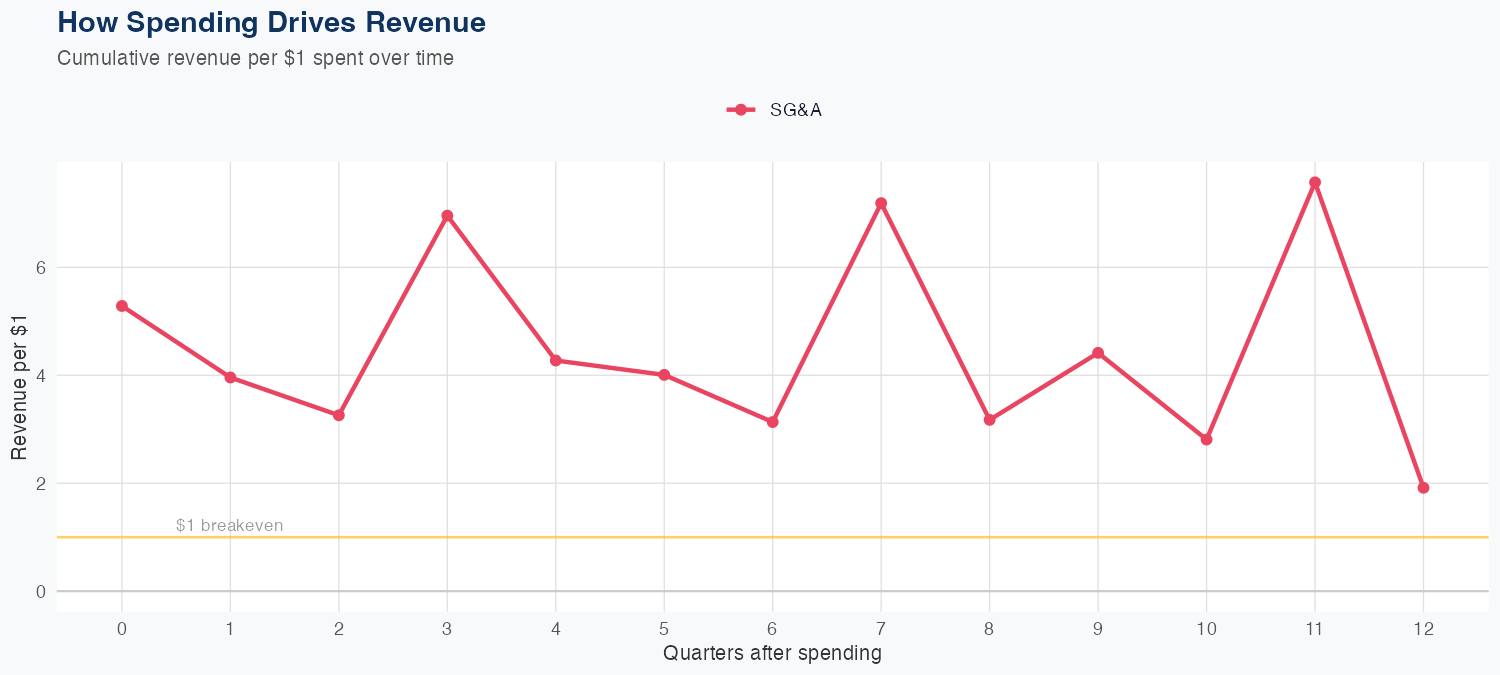
Revenue is driven by efficient SG&A spending, with every $1 of SG&A generating about $1.92 in long-run revenue, indicating strong operating leverage from spend rather than R&D input. The revenue model is linear and backed by 31 quarters of data, with a 2.4% MAPE and a holdout test predicting $3.9B versus actual $3.9B (−1.1% error), supporting the reliability of the driver relationship. The most recent quarter posted revenue of $3.898B. The FY forecast calls for $16B in revenue, up 4.9% year over year, signaling a positive outlook driven by continued SG&A-driven revenue expansion and stable demand.
Investment Thesis
Our ARDL model tracks Tractor Supply Co /De/'s revenue with exceptional precision (2.4% MAPE), indicating highly predictable cash flows. Each $1 of SG&A spending generates $1.92 in revenue, reflecting strong commercial efficiency.
Revenue Forecast
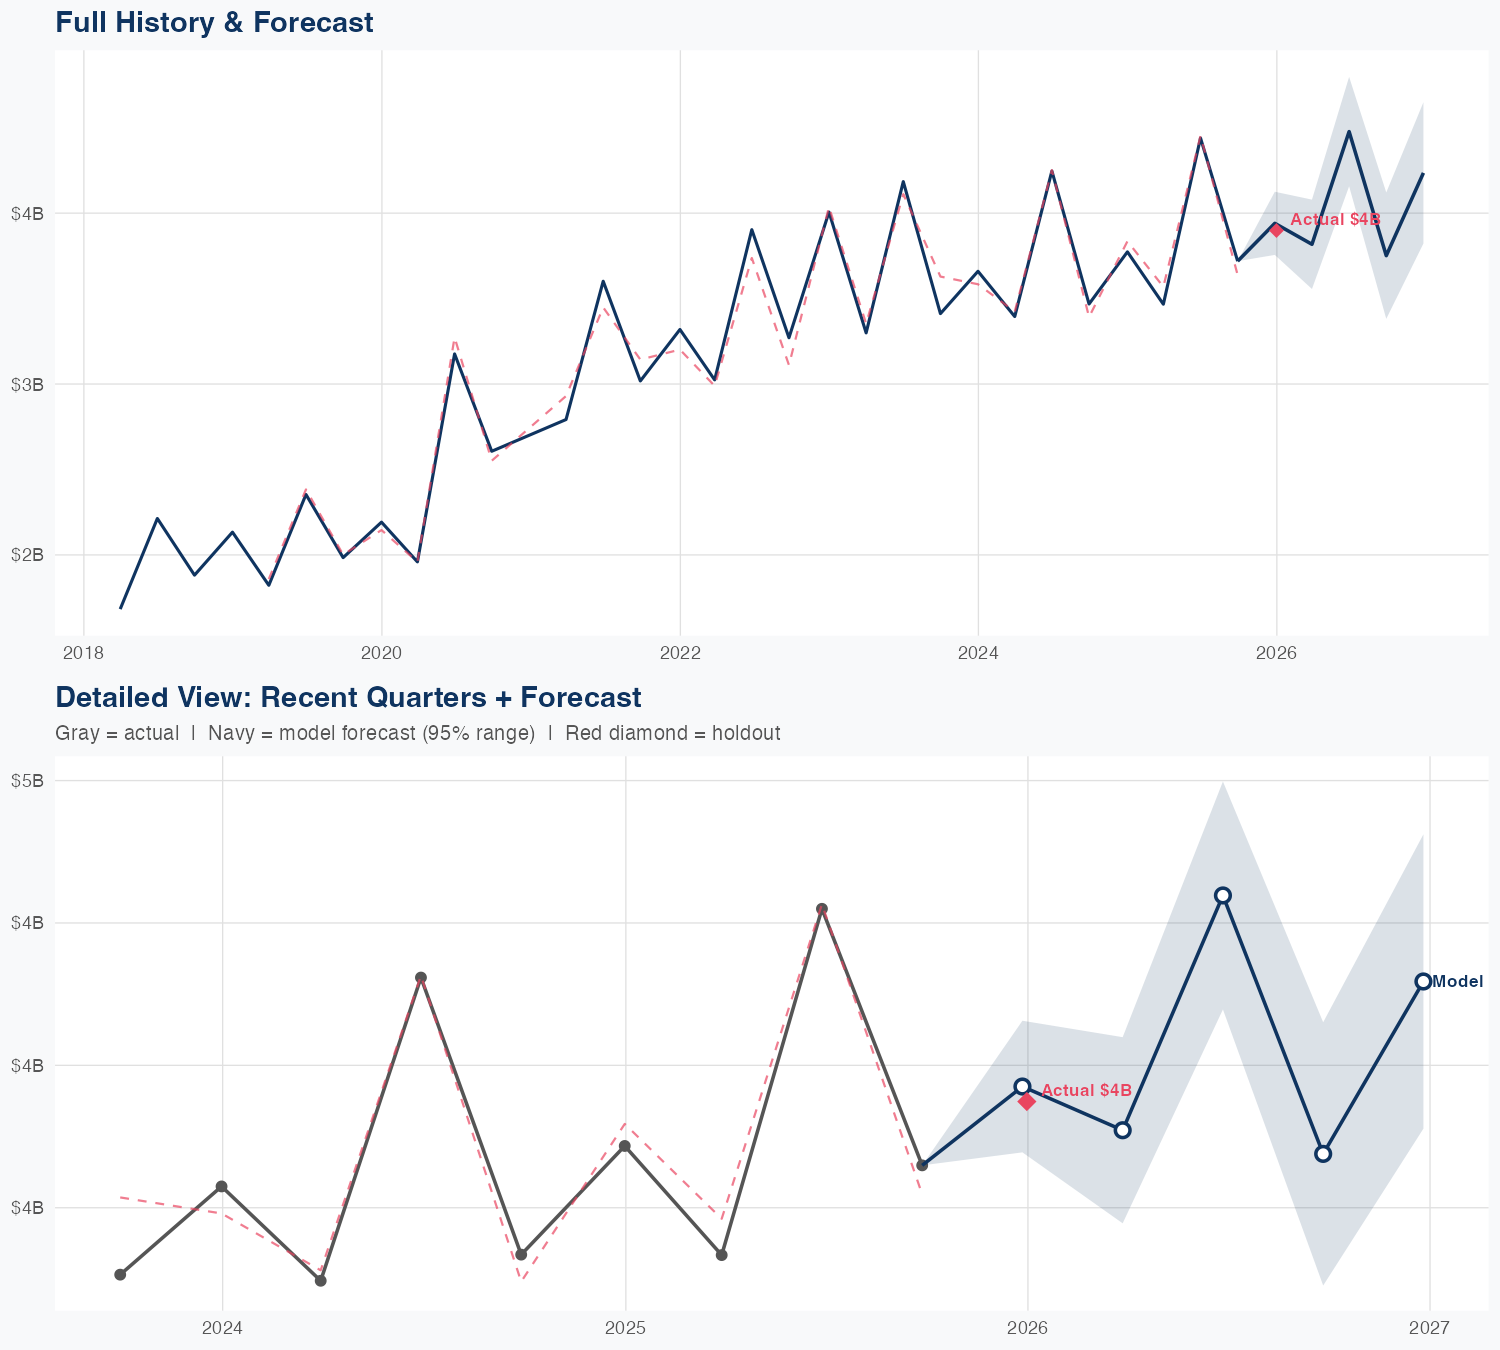
Quarterly Detail
| Quarter | Model Forecast | Actual | 95% Range | YoY Growth | Status |
|---|---|---|---|---|---|
| Q4 2025 | $3.9B | $3.9B | $3.8B – $4.1B | +4.4% | ✓ In range |
| Q1 2026 | $3.8B | $3.6B – $4.1B | +10.1% | ||
| Q2 2026 | $4.5B | $4.2B – $4.8B | +0.8% | ||
| Q3 2026 | $3.8B | $3.4B – $4.1B | +0.9% | ||
| Q4 2026 | $4.2B | $3.8B – $4.6B | +8.7% |
Seasonal Factors
| Fiscal Quarter | Seasonal Factor | vs Trend | Interpretation | Obs. |
|---|---|---|---|---|
| FQ1 (Sep–Nov) | 1.0218 | +2.2% | In line with trend | 7 |
| FQ2 (Dec–Feb) | 1.0212 | +2.1% | In line with trend | 6 |
| FQ3 (Mar–May) | 0.984 | -1.6% | In line with trend | 7 |
| FQ4 (Jun–Aug) | 0.9987 | -0.1% | In line with trend | 7 |
How Spending Drives Revenue
Want this analysis for your portfolio?
I build custom revenue intelligence reports for investors and companies using SEC filing data, econometric modeling, and AI-powered insights.
Get in Touch