Verisk Analytics, Inc. VRSK
Revenue Intelligence Report • 36 quarters of SEC filing data • Updated 2026-03-15
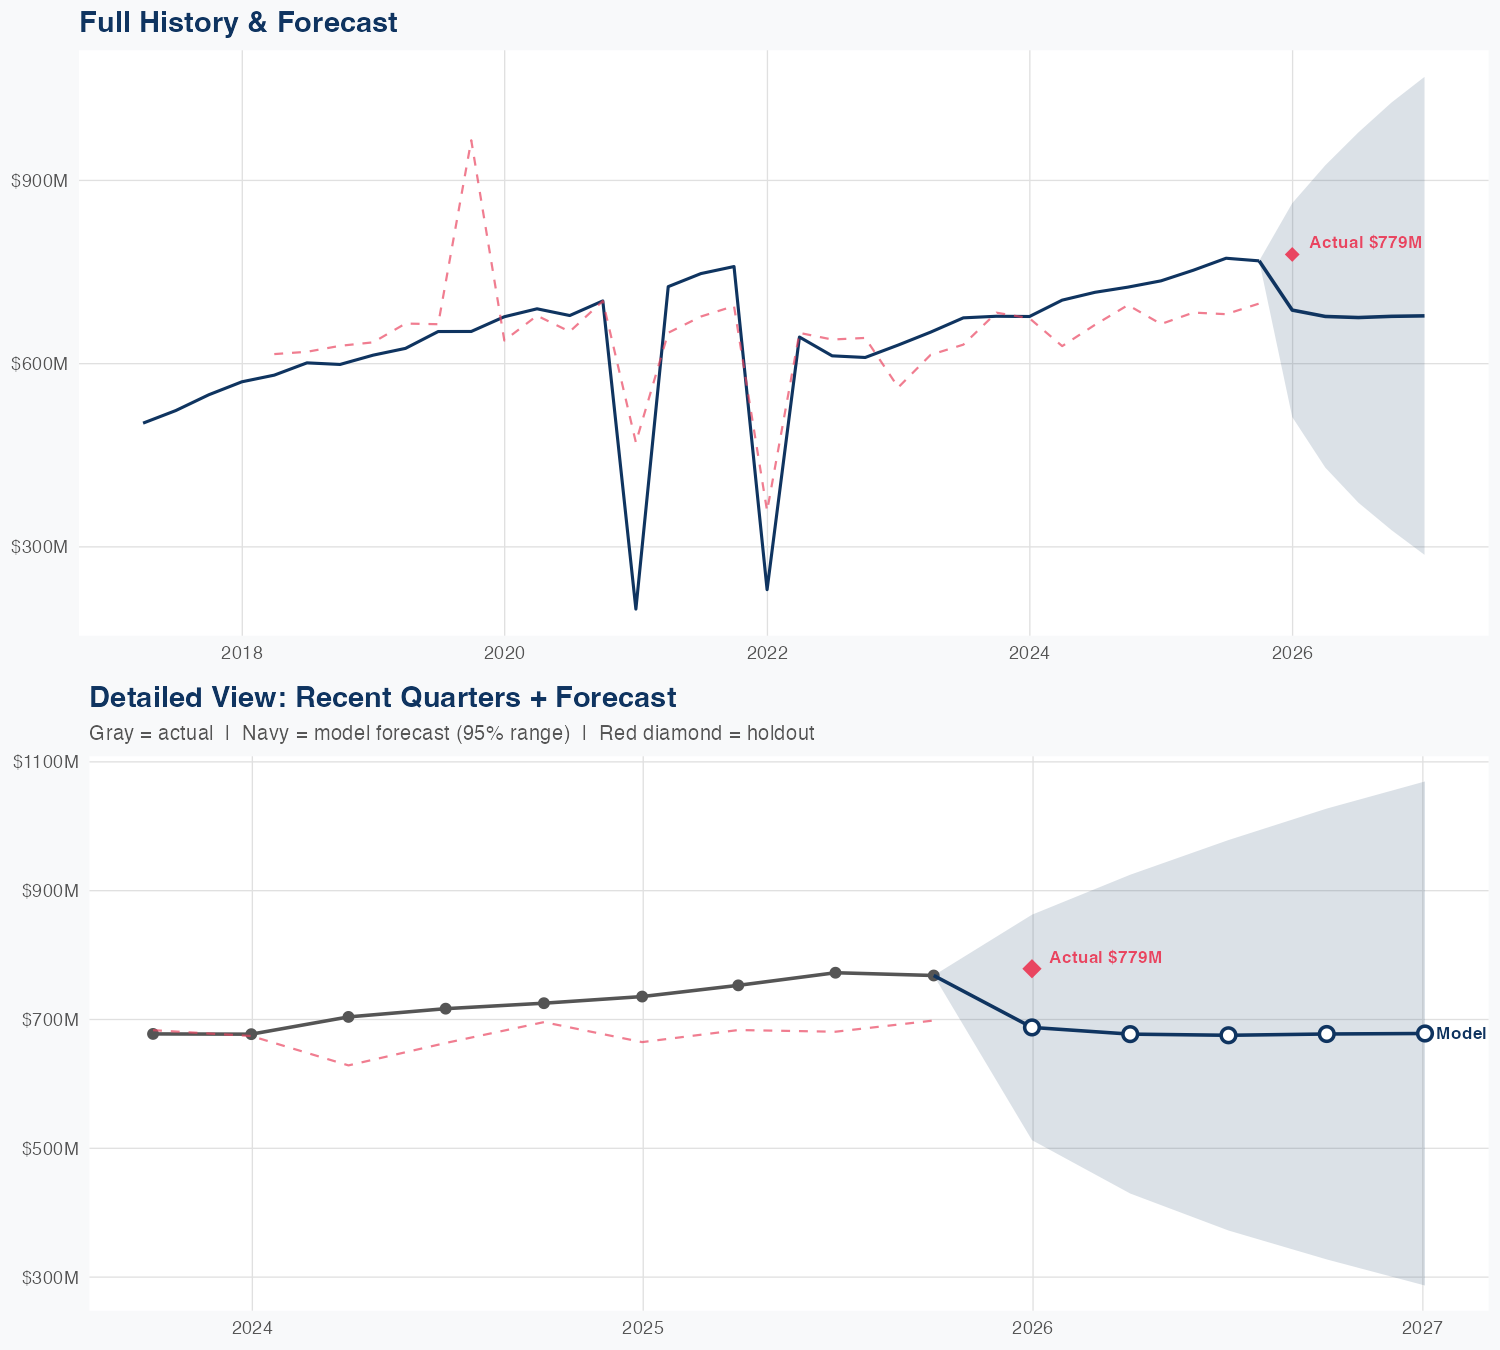
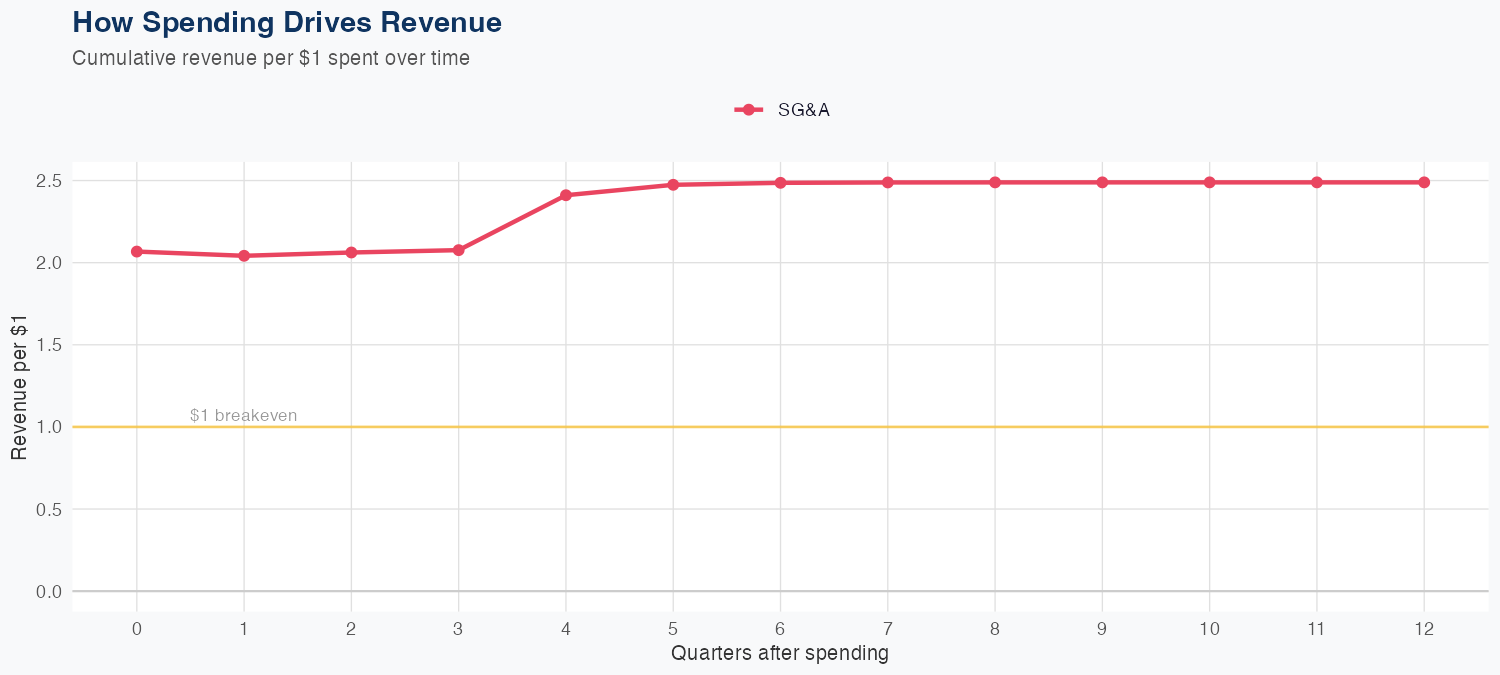
Revenue appears driven by SG&A spending, with a long-run revenue multiplier of 2.49x per $1 of SG&A, making SG&A the main revenue lever under the linear model. The latest quarterly revenue is $779M; with 36 quarters of data, holdout testing yielded 11.7% error against a predicted $688M, and overall MAPE sits at about 12.8%, indicating modest forecast accuracy. The FY revenue forecast is $2,709M, down roughly 11.9% year over year, signaling near-term softness despite the SG&A-driven upside in the long run. Investors should monitor whether SG&A investments translate into the forecasted revenue and whether cost discipline can sustain value as top-line declines continue.
Investment Thesis
At 12.8% MAPE, the model captures Verisk Analytics, Inc.'s broad revenue trajectory, though quarterly variability suggests sensitivity to external factors. Each $1 of SG&A spending generates $2.49 in revenue, reflecting strong commercial efficiency.
Revenue Forecast
Quarterly Detail
| Quarter | Model Forecast | Actual | 95% Range | YoY Growth | Status |
|---|---|---|---|---|---|
| Q4 2025 | $688B | $779B | $513B – $863B | -6.5% | ✓ In range |
| Q2 2026 | $677B | $430B – $925B | -10.1% | ||
| Q3 2026 | $675B | $372B – $979B | -12.6% | ||
| Q4 2026 | $677B | $327B – $1027B | -11.8% | ||
| Q1 2027 | $678B | $287B – $1070B | -12.9% |
Seasonal Factors
| Fiscal Quarter | Seasonal Factor | vs Trend | Interpretation | Obs. |
|---|---|---|---|---|
| FQ1 (Sep–Nov) | 1.0002 | +0.0% | In line with trend | 8 |
| FQ2 (Dec–Feb) | 1.0581 | +5.8% | +5.8% above trend | 8 |
| FQ3 (Mar–May) | 1.0604 | +6.0% | +6.0% above trend | 8 |
| FQ4 (Jun–Aug) | 1.0695 | +7.0% | +7.0% above trend | 8 |
How Spending Drives Revenue
Want this analysis for your portfolio?
I build custom revenue intelligence reports for investors and companies using SEC filing data, econometric modeling, and AI-powered insights.
Get in Touch