West Pharmaceutical Services, Inc. WST
Revenue Intelligence Report • 66 quarters of SEC filing data • Updated 2026-03-15
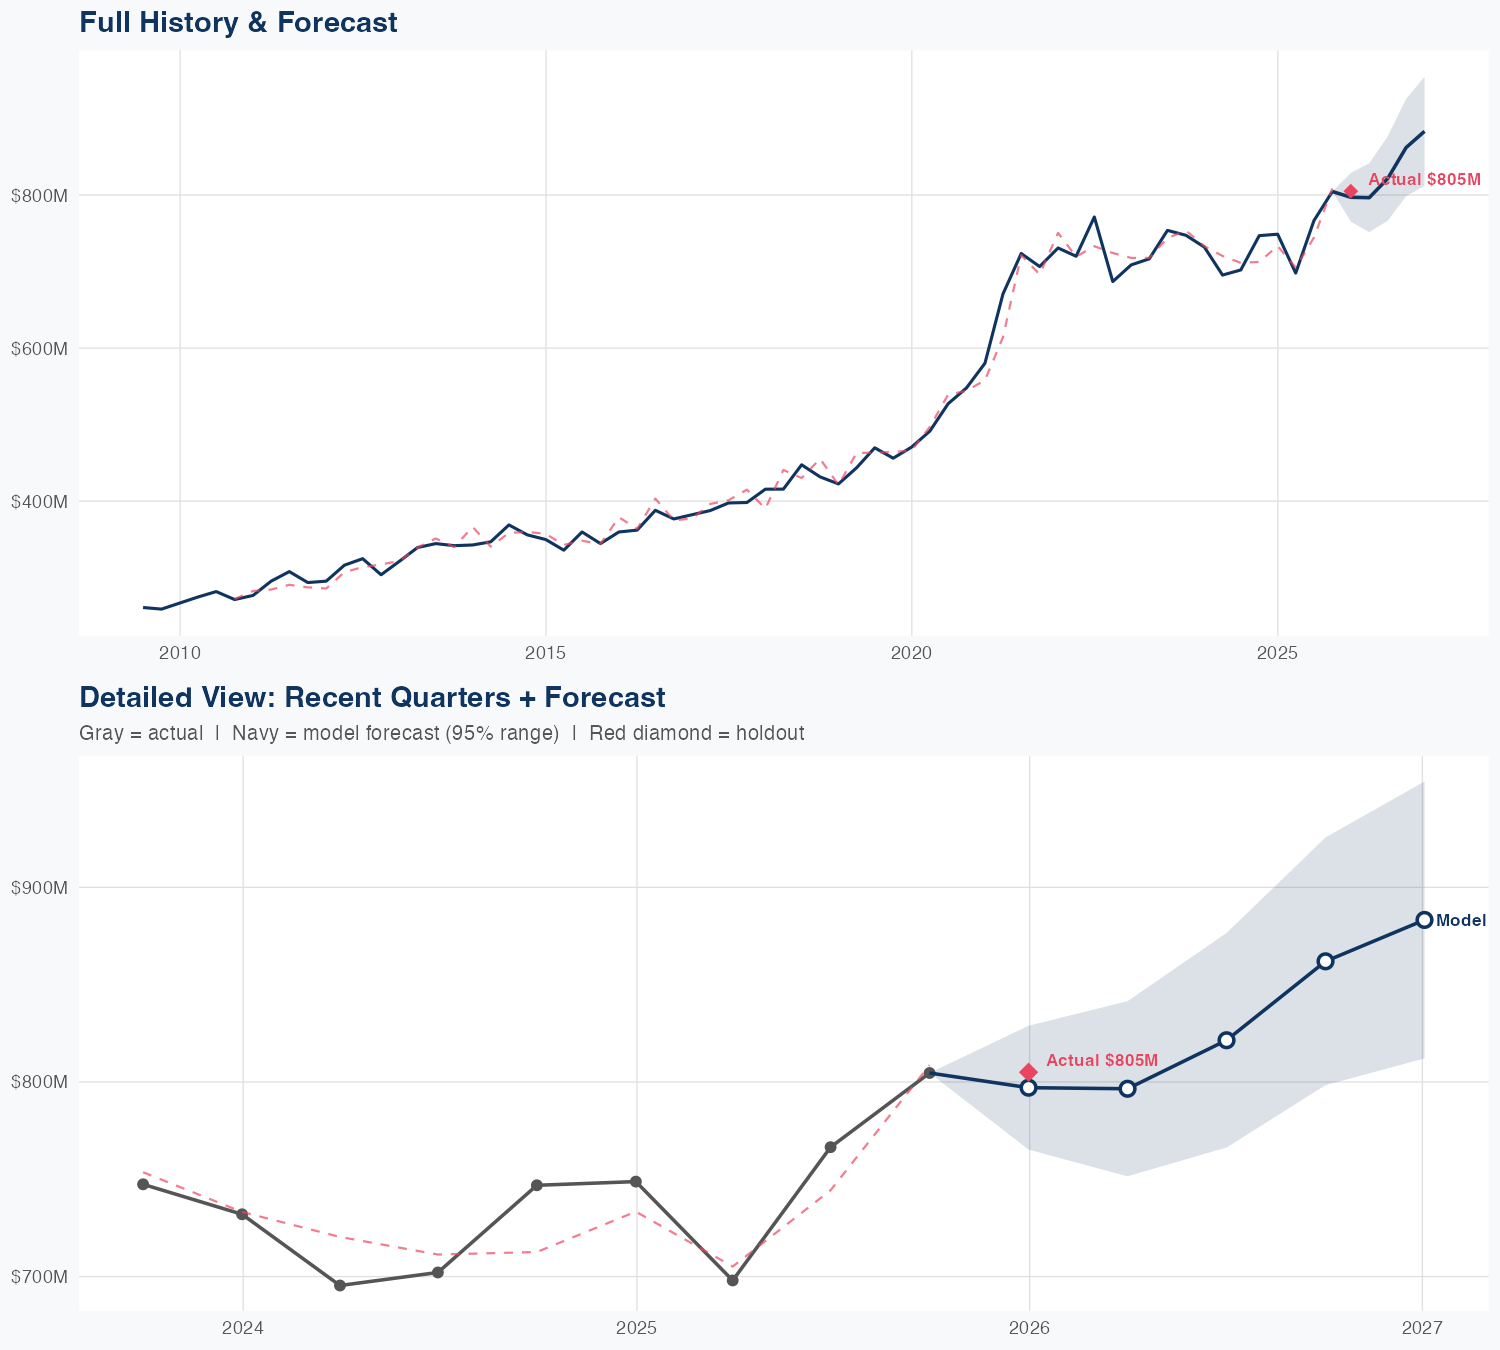
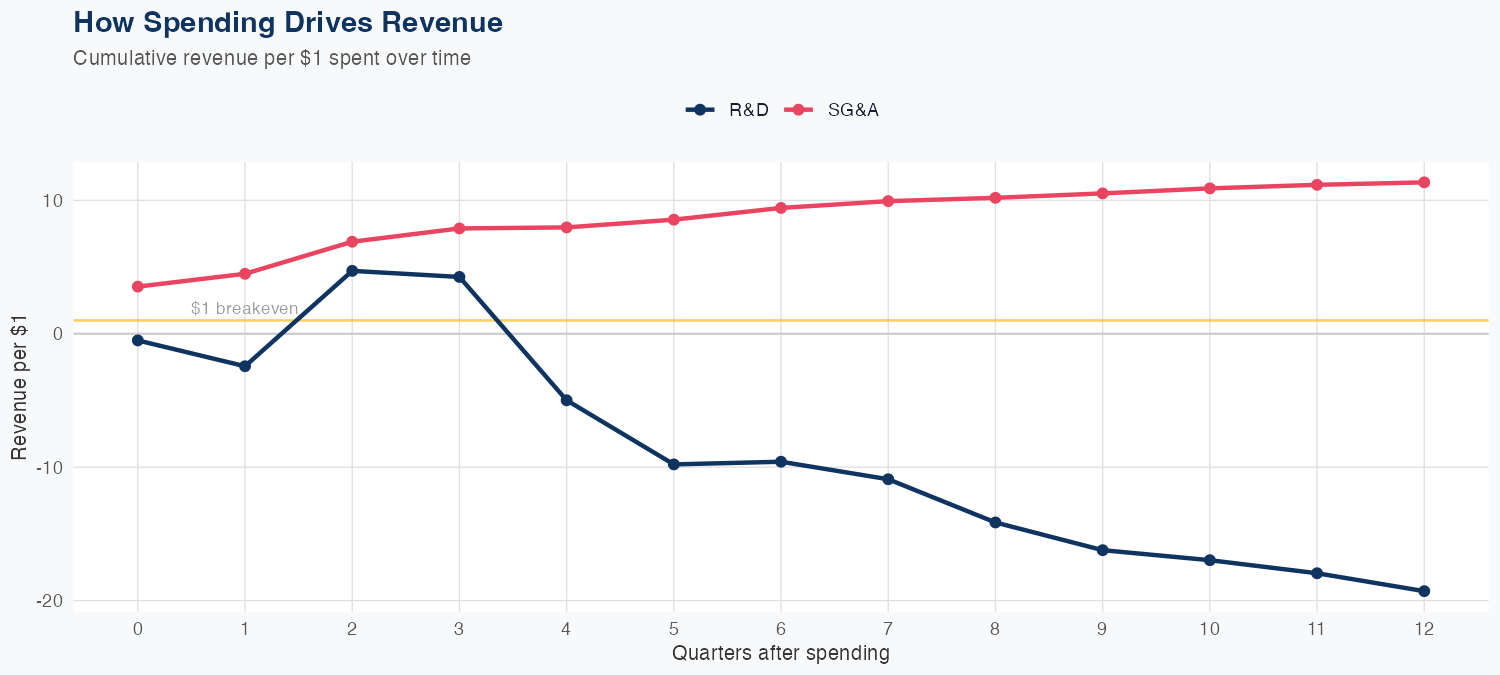
For investors evaluating West Pharmaceutical Services Inc. (WST), revenue is modeled as a linear mix of spending on R&D and SG&A, with each dollar of R&D tied to a long-run revenue delta of -19.29 and each dollar of SG&A tied to +11.35. The model uses 66 quarters of data with 2.5% MAPE, and in a holdout test it predicted 797M versus actual 805M, a 1.0% error. The latest quarterly revenue was 805M, and the FY forecast is 3,363M, up 9.4% year over year. Outlook suggests continued growth driven by SG&A efficiency and constrained by the negative long-run impact of R&D, underscoring the importance of spend mix in sustaining the forecast.
Investment Thesis
Our ARDL model tracks West Pharmaceutical Services, Inc.'s revenue with exceptional precision (2.5% MAPE), indicating highly predictable cash flows. Each $1 of SG&A spending generates $11.35 in revenue, reflecting strong commercial efficiency.
Revenue Forecast
Quarterly Detail
| Quarter | Model Forecast | Actual | 95% Range | YoY Growth | Status |
|---|---|---|---|---|---|
| Q4 2025 | $797B | $805B | $765B – $829B | +6.4% | ✓ In range |
| Q2 2026 | $797B | $752B – $842B | +14.1% | ||
| Q3 2026 | $821B | $766B – $877B | +7.2% | ||
| Q4 2026 | $862B | $798B – $926B | +7.1% | ||
| Q1 2027 | $883B | $812B – $954B | +9.7% |
Seasonal Factors
| Fiscal Quarter | Seasonal Factor | vs Trend | Interpretation | Obs. |
|---|---|---|---|---|
| FQ1 (Sep–Nov) | 0.9976 | -0.2% | In line with trend | 16 |
| FQ2 (Dec–Feb) | 0.9987 | -0.1% | In line with trend | 16 |
| FQ3 (Mar–May) | 0.9955 | -0.4% | In line with trend | 15 |
| FQ4 (Jun–Aug) | 1.0136 | +1.4% | In line with trend | 15 |
How Spending Drives Revenue
Want this analysis for your portfolio?
I build custom revenue intelligence reports for investors and companies using SEC filing data, econometric modeling, and AI-powered insights.
Get in Touch