Automatic Data Processing, Inc. ADP
Revenue Intelligence Report • 11 quarters of SEC filing data • Updated 2026-03-15
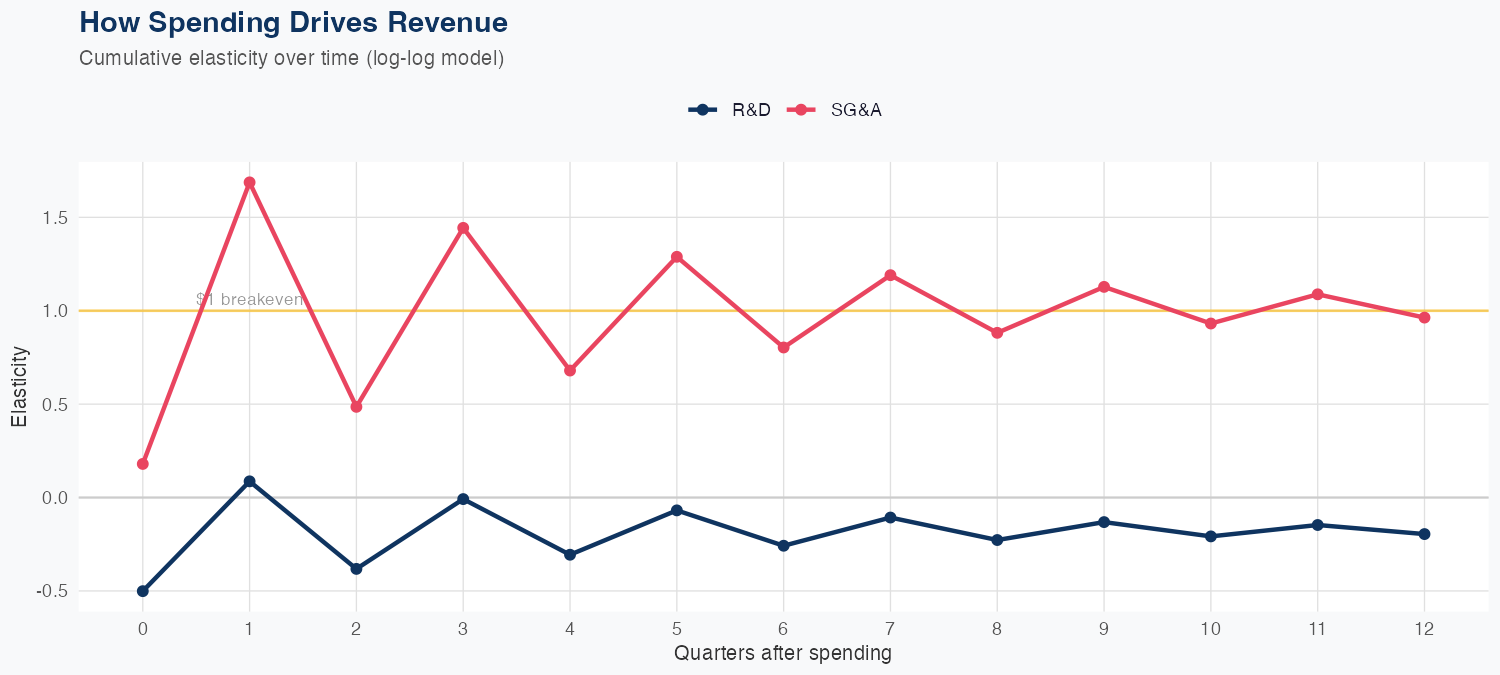
Within the model, SG&A spending drives revenue with an elasticity of about 0.96% per 1% increase, while R&D spending has a negative elasticity of -0.20%, implying higher R&D is associated with slightly lower revenue. This suggests a near unit ROI from SG&A investments and a negative ROI signal from incremental R&D, pointing to reallocation toward efficiency-focused SG&A initiatives. The model demonstrates solid reliability, with a 2.0% MAPE and a holdout error of -0.7% on a $5.4B test, underscoring the credibility of the inputs and forecasts. The FY revenue forecast is $22B, up 5.9% year over year, indicating a positive growth trajectory supported by the model, though investors should monitor the mix of SG&A and R&D spending to sustain momentum.
Investment Thesis
Our ARDL model tracks Automatic Data Processing, Inc.'s revenue with exceptional precision (2.0% MAPE), indicating highly predictable cash flows. R&D spending currently shows a negative elasticity (-0.20x), which can indicate heavy investment in long-cycle initiatives not yet reflected in revenue. Sales & marketing spend shows a 0.96x elasticity, suggesting effective go-to-market execution.
Revenue Forecast
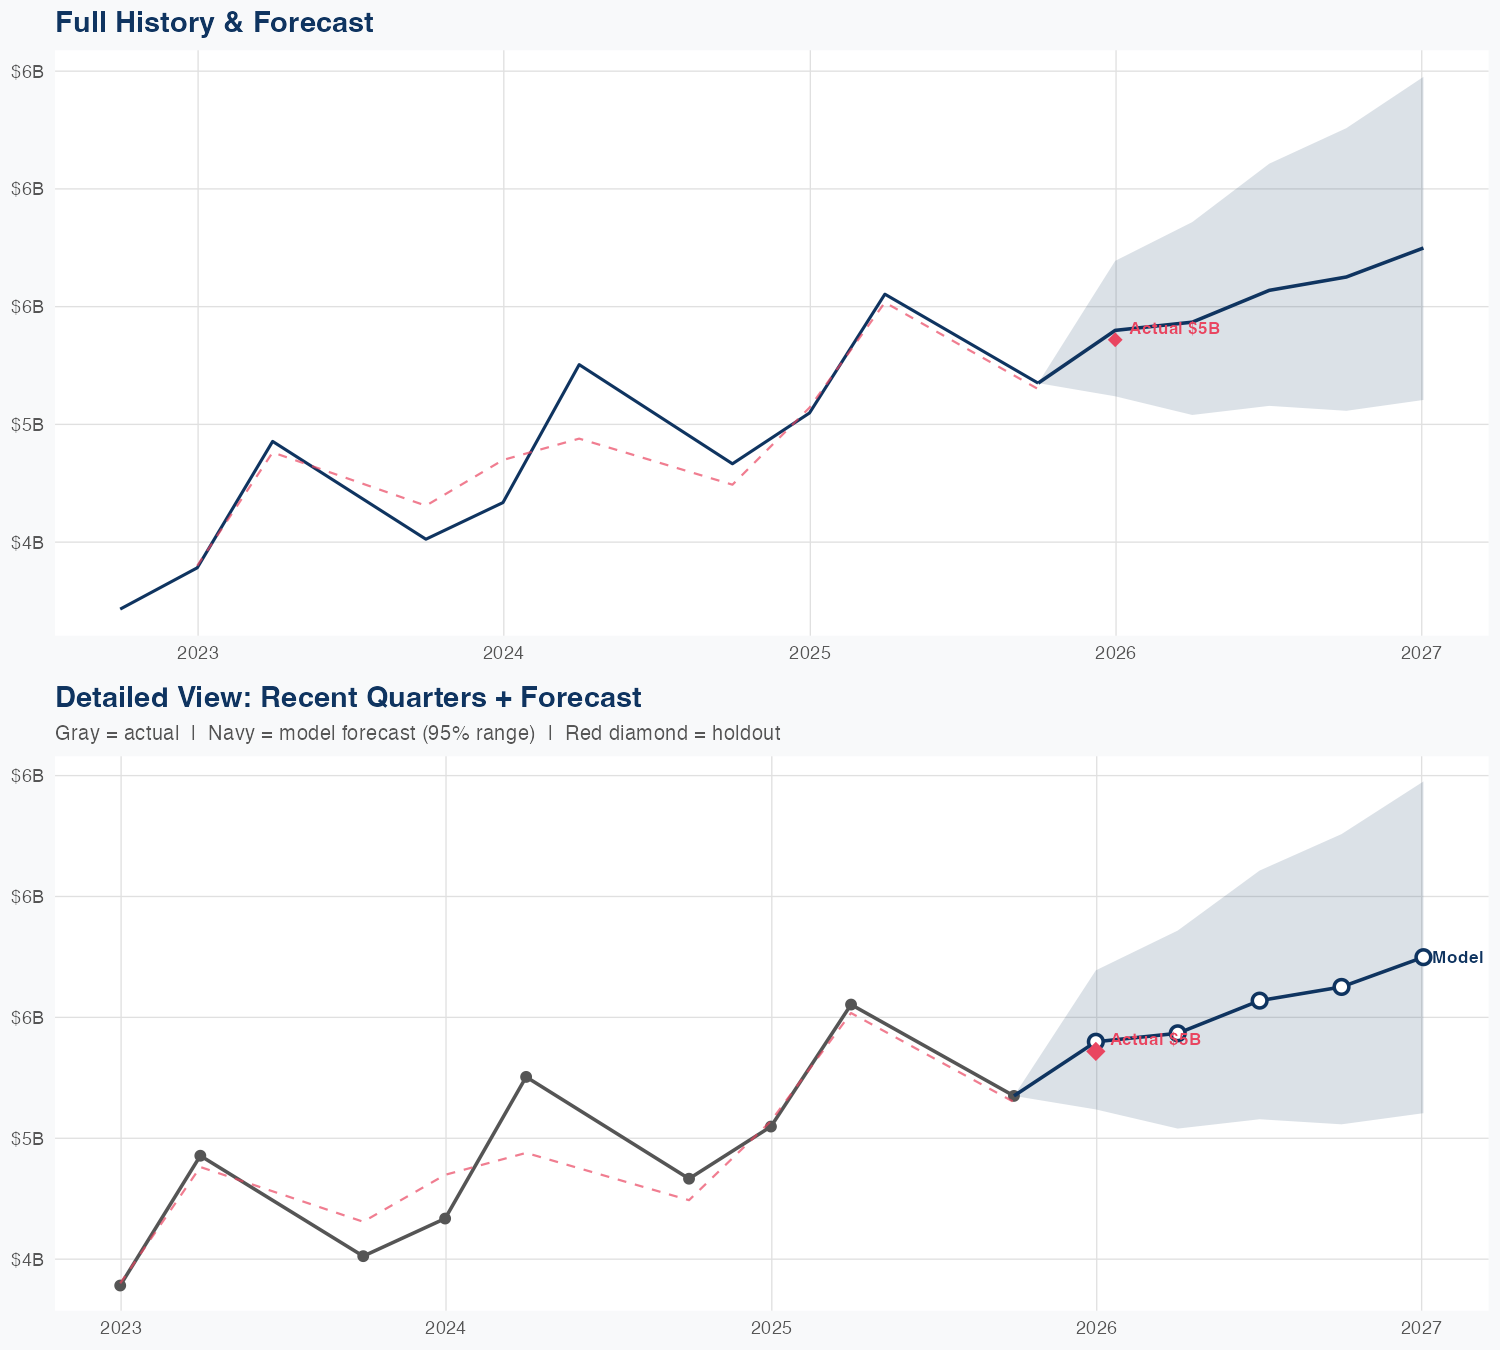
Quarterly Detail
| Quarter | Model Forecast | Actual | 95% Range | YoY Growth | Status |
|---|---|---|---|---|---|
| Q4 2025 | $5.4B | $5.4B | $5.1B – $5.7B | +11.7% | ✓ In range |
| Q2 2026 | $5.4B | $5.0B – $5.9B | +7.6% | ||
| Q3 2026 | $5.6B | $5.1B – $6.1B | +0.3% | ||
| Q4 2026 | $5.6B | $5.1B – $6.3B | +8.7% | ||
| Q1 2027 | $5.7B | $5.1B – $6.5B | +7.3% |
How Spending Drives Revenue
Want this analysis for your portfolio?
I build custom revenue intelligence reports for investors and companies using SEC filing data, econometric modeling, and AI-powered insights.
Get in Touch