Autodesk, Inc. ADSK
Revenue Intelligence Report • 72 quarters of SEC filing data • Updated 2026-03-15
Autodesk, Inc. has a forecasted full-year revenue of $8.1B, a +12.9% year-over-year change, based on 72 quarters of SEC filing data. Key revenue drivers include SG&A ($2.71 per $1). The ARDL model has 617.0% MAPE.
Investment Thesis
At 617.0% MAPE, the model captures Autodesk, Inc.'s broad revenue trajectory, though quarterly variability suggests sensitivity to external factors. Each $1 of SG&A spending generates $2.71 in revenue, reflecting strong commercial efficiency.
Next FY Revenue
$8.13B
+12.9% YoY
R&D Multiplier
$-7.87 per $1
SG&A Multiplier
$2.71 per $1
Model Accuracy
617.0% MAPE
Holdout validation: The model predicted $1.8B vs the actual $2.0B — an error of 5.9%.
⚠ Model limitation:
This company shows negative spending multipliers, meaning increases in spending have not directly translated into revenue growth. This typically occurs with commodity-driven companies or hypergrowth companies.
Revenue Forecast
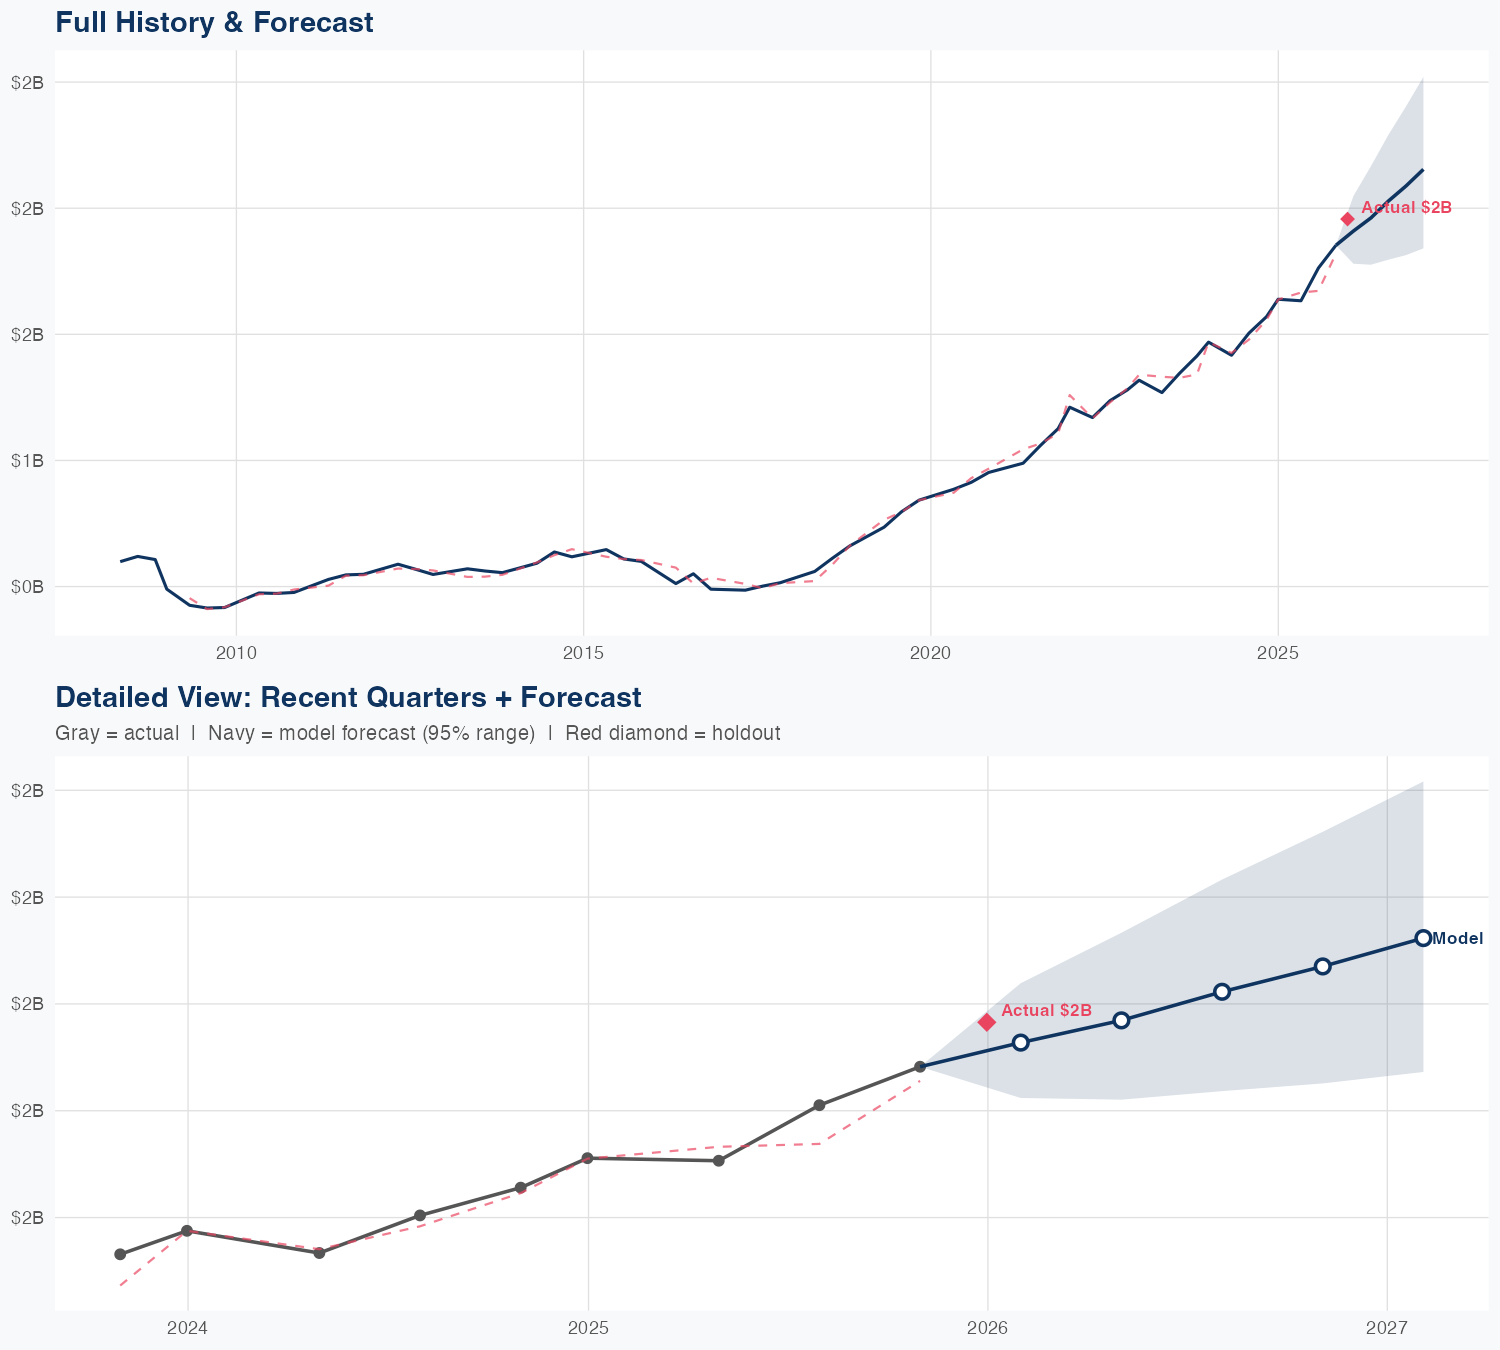
Quarterly Detail
| Quarter | Model Forecast | Actual | 95% Range | YoY Growth | Status |
|---|---|---|---|---|---|
| Q1 2026 | $1.8B | $2.0B | $1.6B – $2.1B | +12.3% | ✓ In range |
| Q2 2026 | $1.9B | $1.6B – $2.2B | +17.7% | ||
| Q3 2026 | $2.0B | $1.6B – $2.4B | +14.4% | ||
| Q4 2026 | $2.1B | $1.6B – $2.5B | +12.7% | ||
| Q1 2027 | $2.1B | $1.6B – $2.6B | +7.6% |
Seasonal Factors
Multiplicative seasonal adjustment:
These factors capture Autodesk, Inc.'s systematic quarterly revenue patterns relative to the trend model.
A factor of 1.05 means that quarter typically runs 5% above the underlying trend; 0.95 means 5% below.
Factors are computed as the median of (actual / fitted) across all available quarters.
| Fiscal Quarter | Seasonal Factor | vs Trend | Interpretation | Obs. |
|---|---|---|---|---|
| FQ1 (Sep–Nov) | 1.0023 | +0.2% | In line with trend | 17 |
| FQ2 (Dec–Feb) | 0.0134 | -98.7% | -98.7% below trend | 13 |
| FQ3 (Mar–May) | 0.9986 | -0.1% | In line with trend | 17 |
| FQ4 (Jun–Aug) | 1.0388 | +3.9% | +3.9% above trend | 17 |
How Spending Drives Revenue
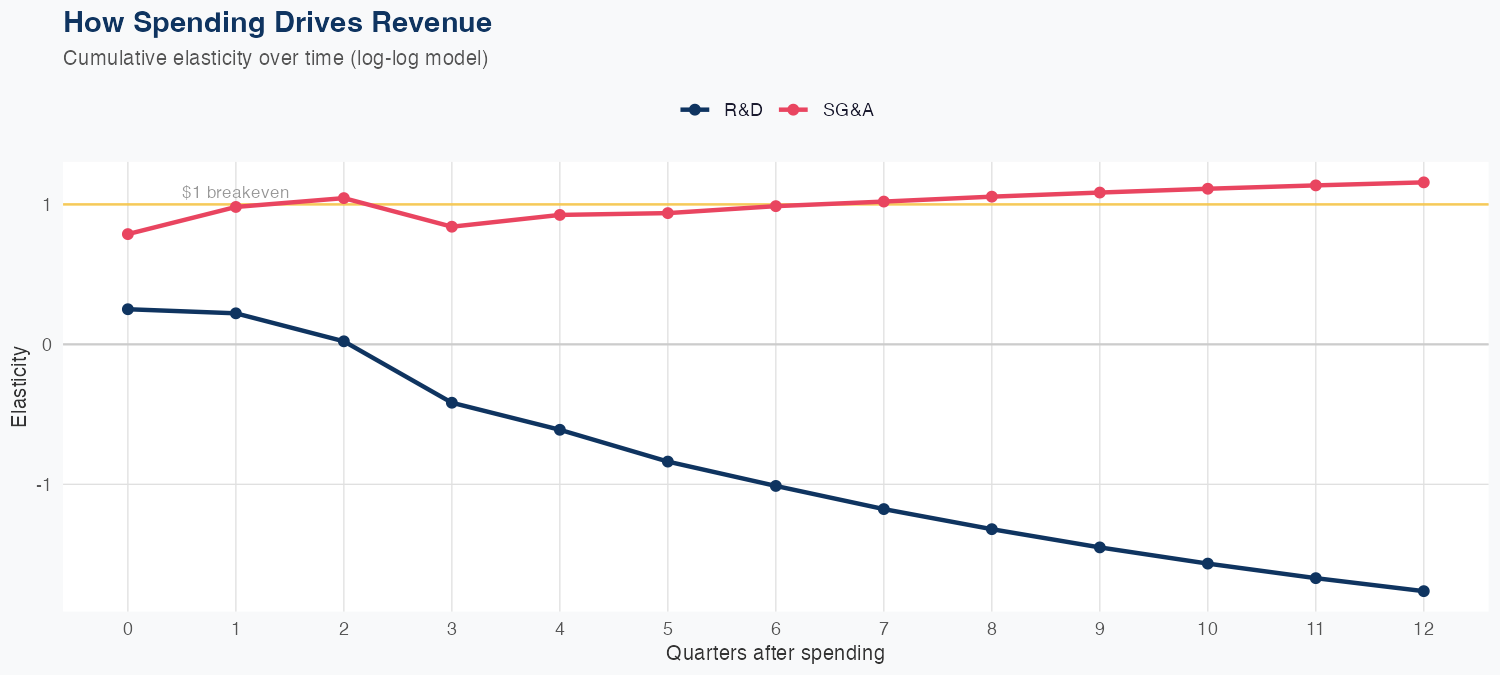
Reading this chart:
Each line shows the cumulative revenue generated per $1 spent over subsequent quarters. The effect builds over 4-5 quarters as investments mature.
Want this analysis for your portfolio?
I build custom revenue intelligence reports for investors and companies using SEC filing data, econometric modeling, and AI-powered insights.
Get in Touch