Best Buy Co., Inc. BBY
Revenue Intelligence Report • 60 quarters of SEC filing data • Updated 2026-03-15
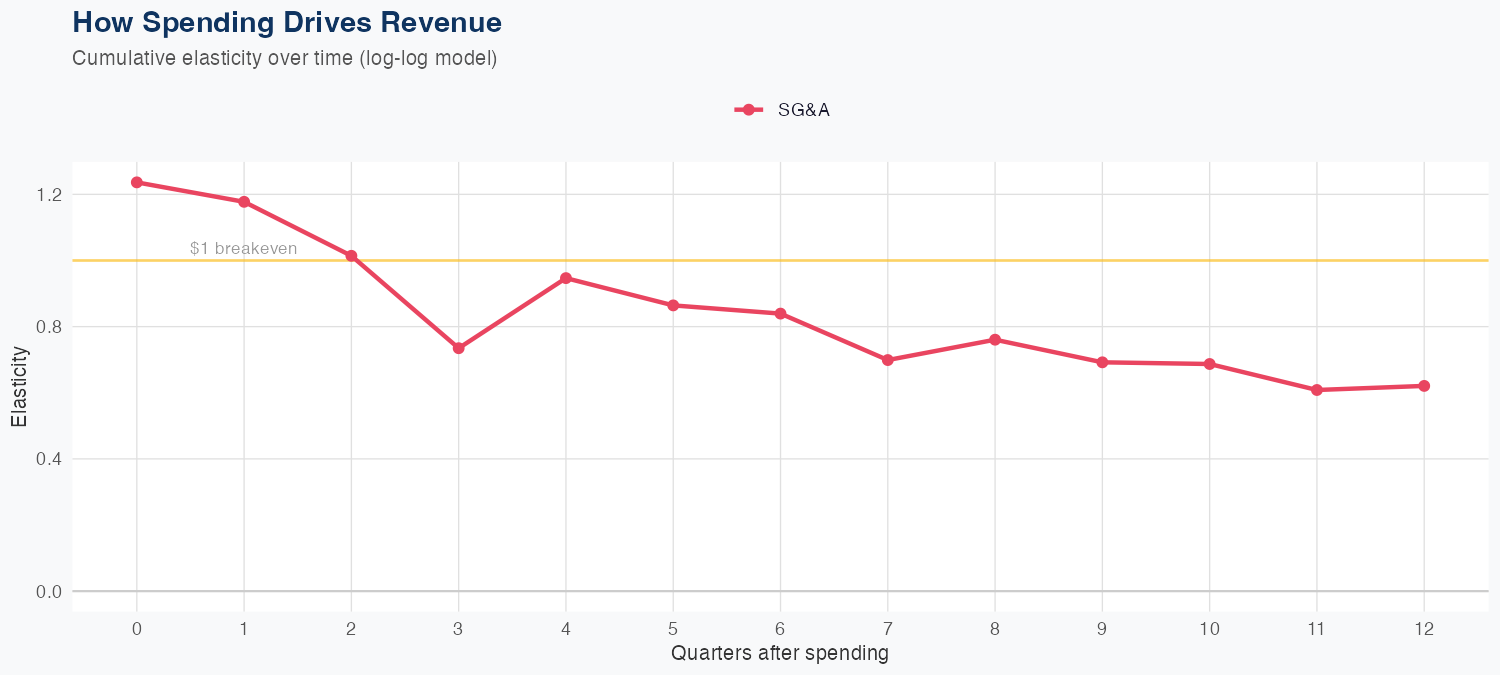
Revenue is primarily driven by SG&A spending, with a 1% increase in SG&A yielding a 0.63% increase in revenue, indicating a positive but sublinear ROI from selling, general, and administrative expenses under a log-log model. The model’s out-of-sample test predicted $9.3B versus actual $9.7B (4.0% error), supporting reasonable forecasting accuracy. The latest quarterly revenue is about $9.67B, and the full-year forecast is $39B, a 5.8% decline year over year. With SG&A as the main growth lever but delivering less than proportional gains, investors should focus on optimizing marketing and selling efficiency to protect margins amid a cautious outlook.
Investment Thesis
The econometric model achieves strong accuracy (3.7% MAPE), suggesting Best Buy Co., Inc.'s revenue trajectory is well-characterized by its spending patterns. Sales & marketing spend shows a 0.63x elasticity, suggesting effective go-to-market execution.
Revenue Forecast
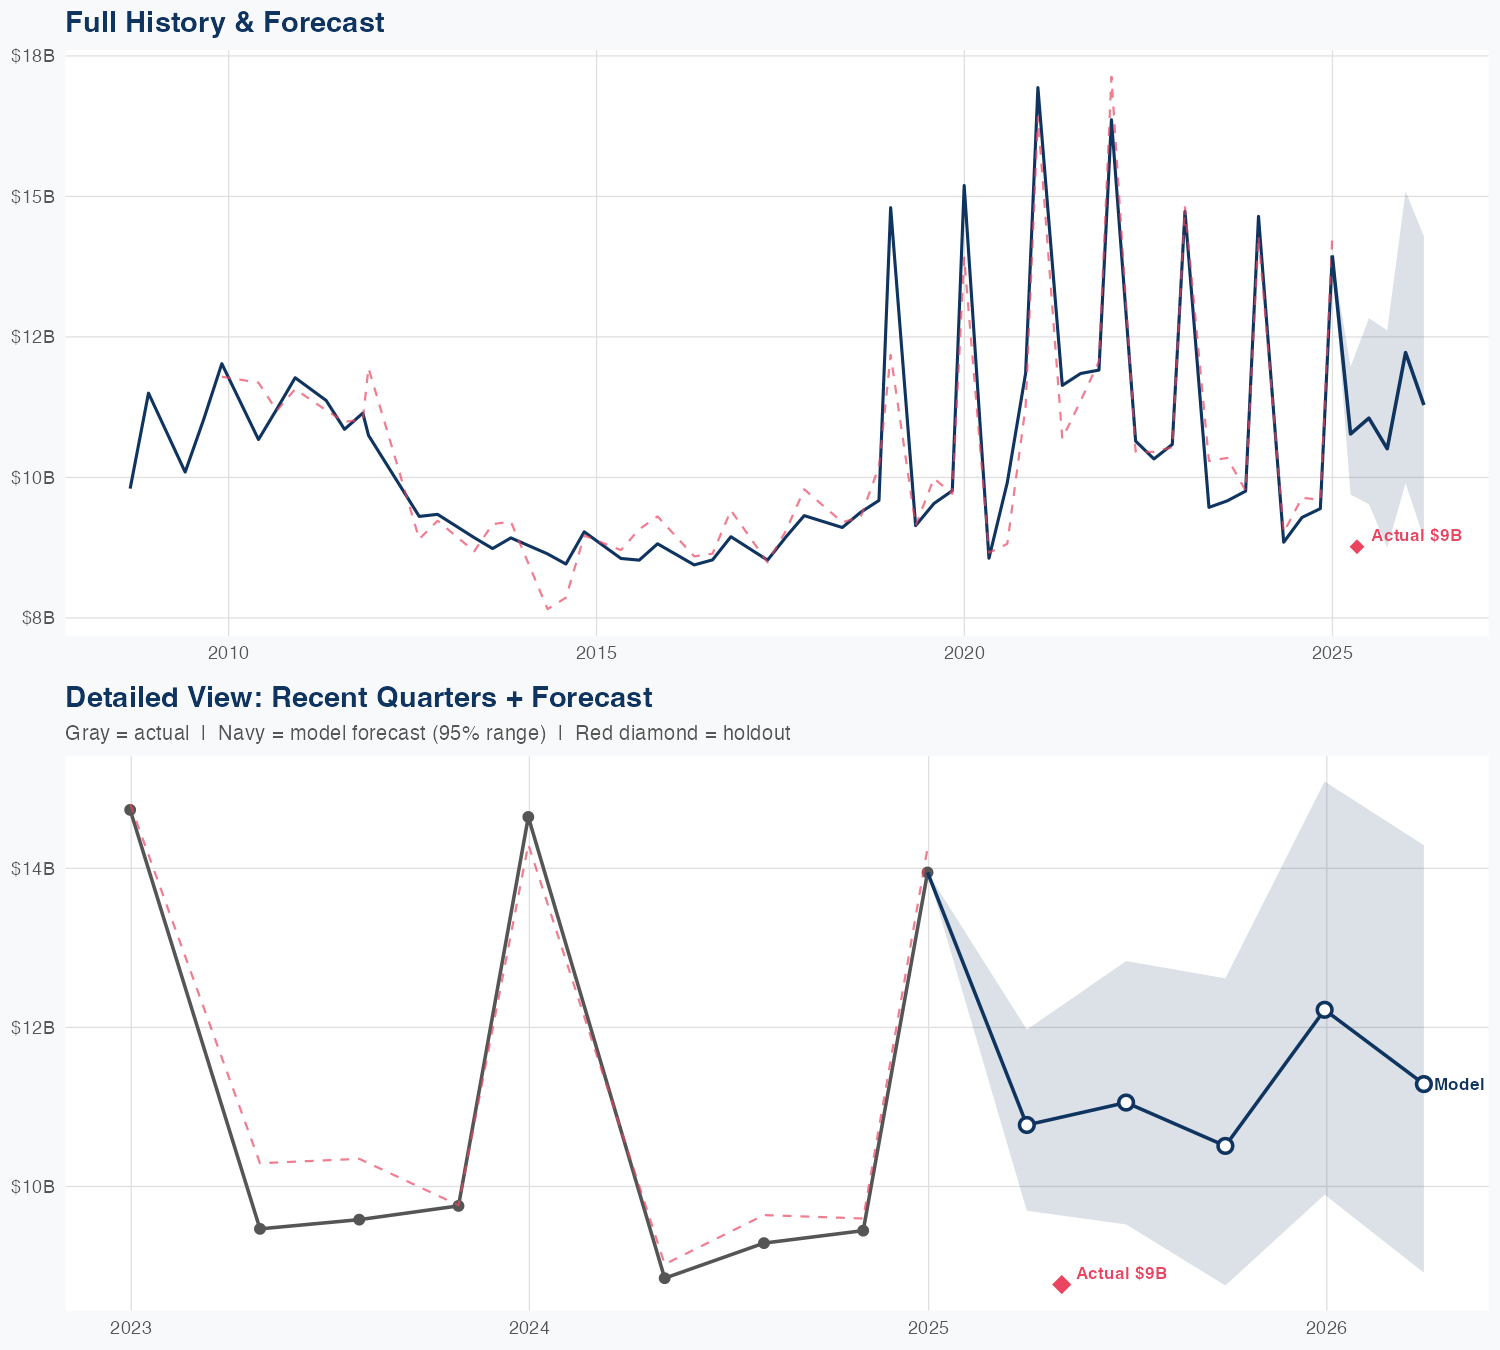
Quarterly Detail
| Quarter | Model Forecast | Actual | 95% Range | YoY Growth | Status |
|---|---|---|---|---|---|
| Q4 2025 | $9.3B | $9.7B | $8.4B – $10B | -1.7% | ✓ In range |
| Q1 2026 | $11B | $9.4B – $13B | -22.0% | ||
| Q2 2026 | $9.4B | $7.9B – $11B | +7.2% | ||
| Q3 2026 | $9.8B | $7.9B – $12B | +3.5% | ||
| Q4 2026 | $9.4B | $7.4B – $12B | -3.2% |
Seasonal Factors
| Fiscal Quarter | Seasonal Factor | vs Trend | Interpretation | Obs. |
|---|---|---|---|---|
| FQ1 (Sep–Nov) | 1.0037 | +0.4% | In line with trend | 18 |
| FQ2 (Dec–Feb) | 1.0244 | +2.4% | In line with trend | 7 |
| FQ3 (Mar–May) | 0.9979 | -0.2% | In line with trend | 15 |
| FQ4 (Jun–Aug) | 0.9892 | -1.1% | In line with trend | 16 |
How Spending Drives Revenue
Want this analysis for your portfolio?
I build custom revenue intelligence reports for investors and companies using SEC filing data, econometric modeling, and AI-powered insights.
Get in Touch