Cadence Design Systems, Inc. CDNS
Revenue Intelligence Report • 18 quarters of SEC filing data • Updated 2026-03-15
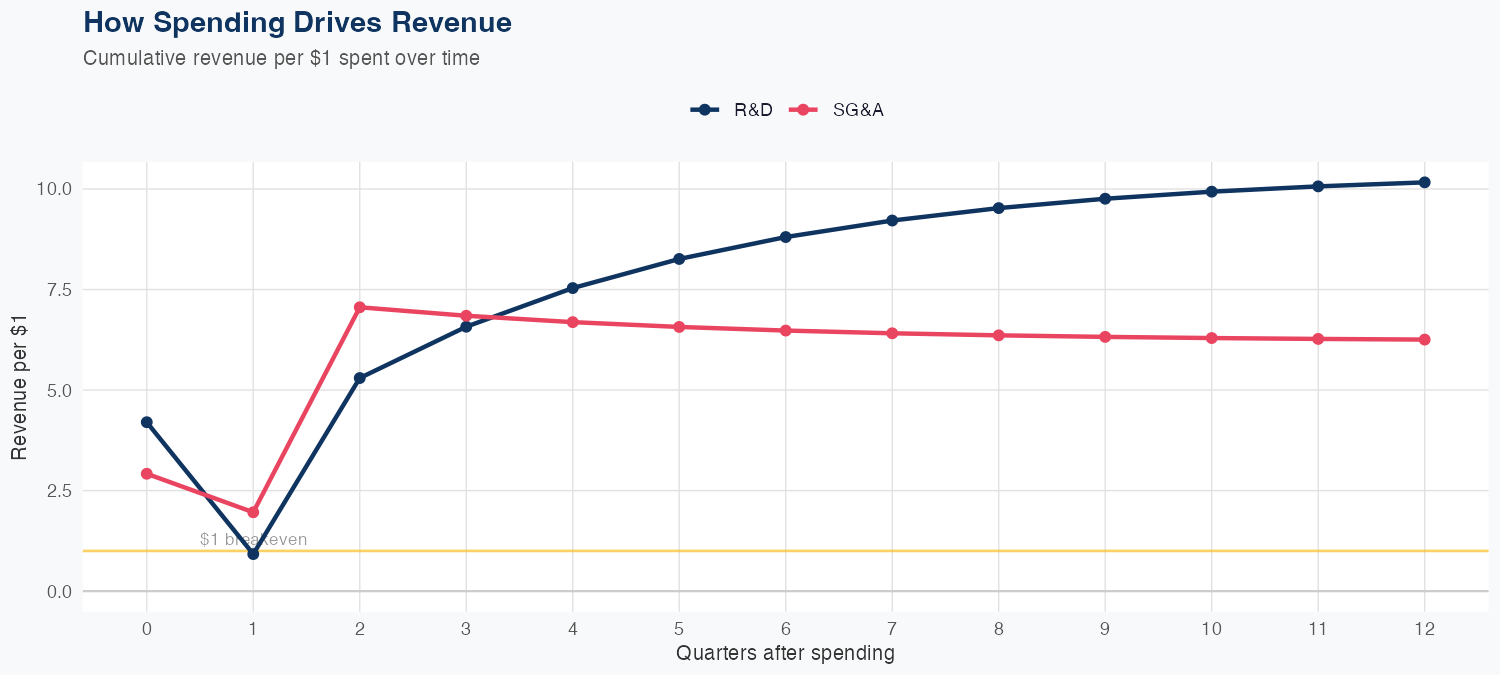
Revenue is driven by demand for design automation platforms and services, with the latest quarterly revenue of $1.339 billion and an 18-quarter data history that supports a linear relationship between inputs and long-run revenue. ROI of spending shows $1 of R&D yields $10.16 of long-run revenue, while SG&A yields $6.25, indicating R&D investments deliver a higher marginal contribution to revenue. The model delivers a 2.2% MAPE and, on holdout, a predicted $1.4B versus actual $1.3B (about -5.1% error), suggesting reasonable predictive reliability. The FY forecast of $6.3B revenue, up 24.4% year over year, points to solid growth momentum supported by the efficient R&D-driven revenue generation.
Investment Thesis
Our ARDL model tracks Cadence Design Systems, Inc.'s revenue with exceptional precision (2.2% MAPE), indicating highly predictable cash flows. Every $1 of R&D investment is associated with $10.16 of revenue, indicating efficient capital deployment in innovation. Each $1 of SG&A spending generates $6.25 in revenue, reflecting strong commercial efficiency.
Revenue Forecast
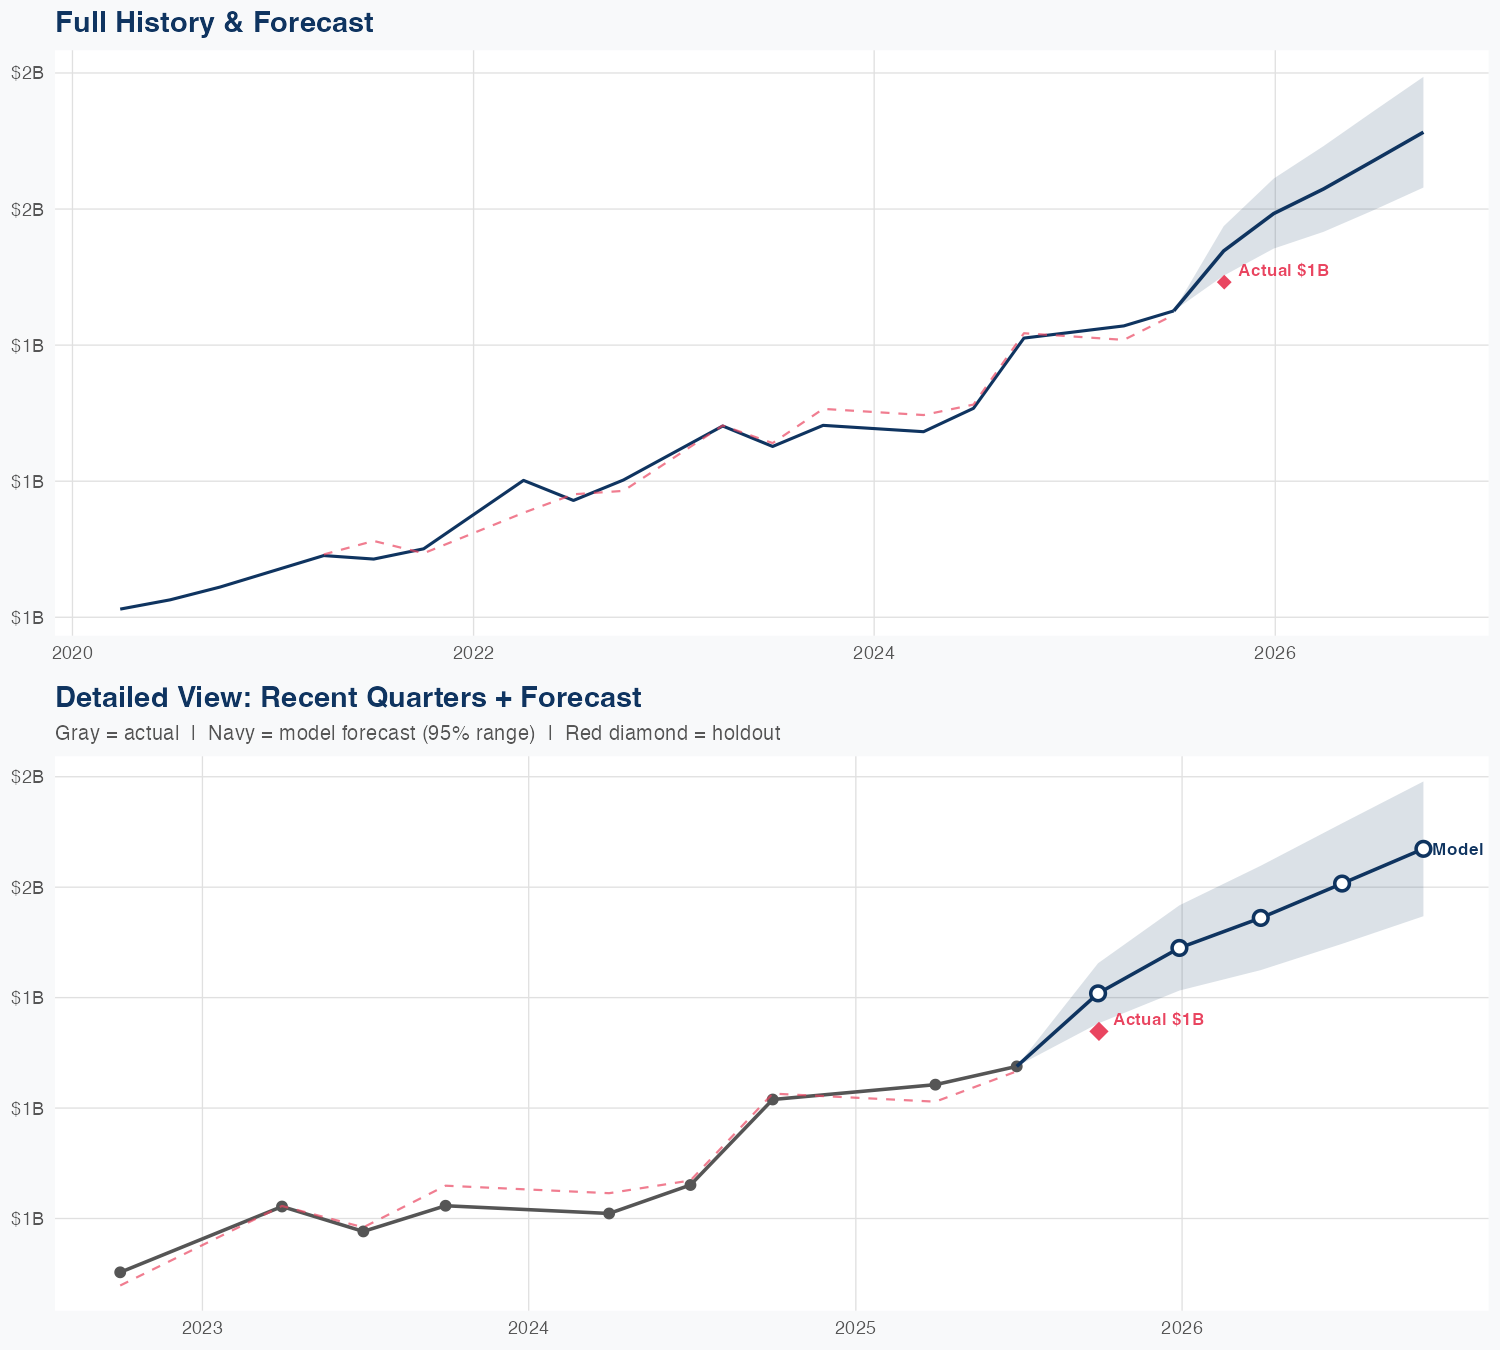
Quarterly Detail
| Quarter | Model Forecast | Actual | 95% Range | YoY Growth | Status |
|---|---|---|---|---|---|
| Q3 2025 | $1.4B | $1.3B | $1.4B – $1.5B | +32.7% | ✗ Outside range |
| Q4 2025 | $1.5B | $1.4B – $1.6B | +22.6% | ||
| Q1 2026 | $1.5B | $1.4B – $1.6B | +24.3% | ||
| Q2 2026 | $1.6B | $1.5B – $1.7B | +26.0% | ||
| Q3 2026 | $1.7B | $1.5B – $1.8B | +24.7% |
Seasonal Factors
| Fiscal Quarter | Seasonal Factor | vs Trend | Interpretation | Obs. |
|---|---|---|---|---|
| FQ1 (Sep–Nov) | 1.0086 | +0.9% | In line with trend | 5 |
| FQ2 (Dec–Feb) | 1.0 | +0.0% | In line with trend | 0 |
| FQ3 (Mar–May) | 0.999 | -0.1% | In line with trend | 5 |
| FQ4 (Jun–Aug) | 0.9923 | -0.8% | In line with trend | 5 |
How Spending Drives Revenue
Want this analysis for your portfolio?
I build custom revenue intelligence reports for investors and companies using SEC filing data, econometric modeling, and AI-powered insights.
Get in Touch