Cummins Inc. CMI
Revenue Intelligence Report • 70 quarters of SEC filing data • Updated 2026-03-15
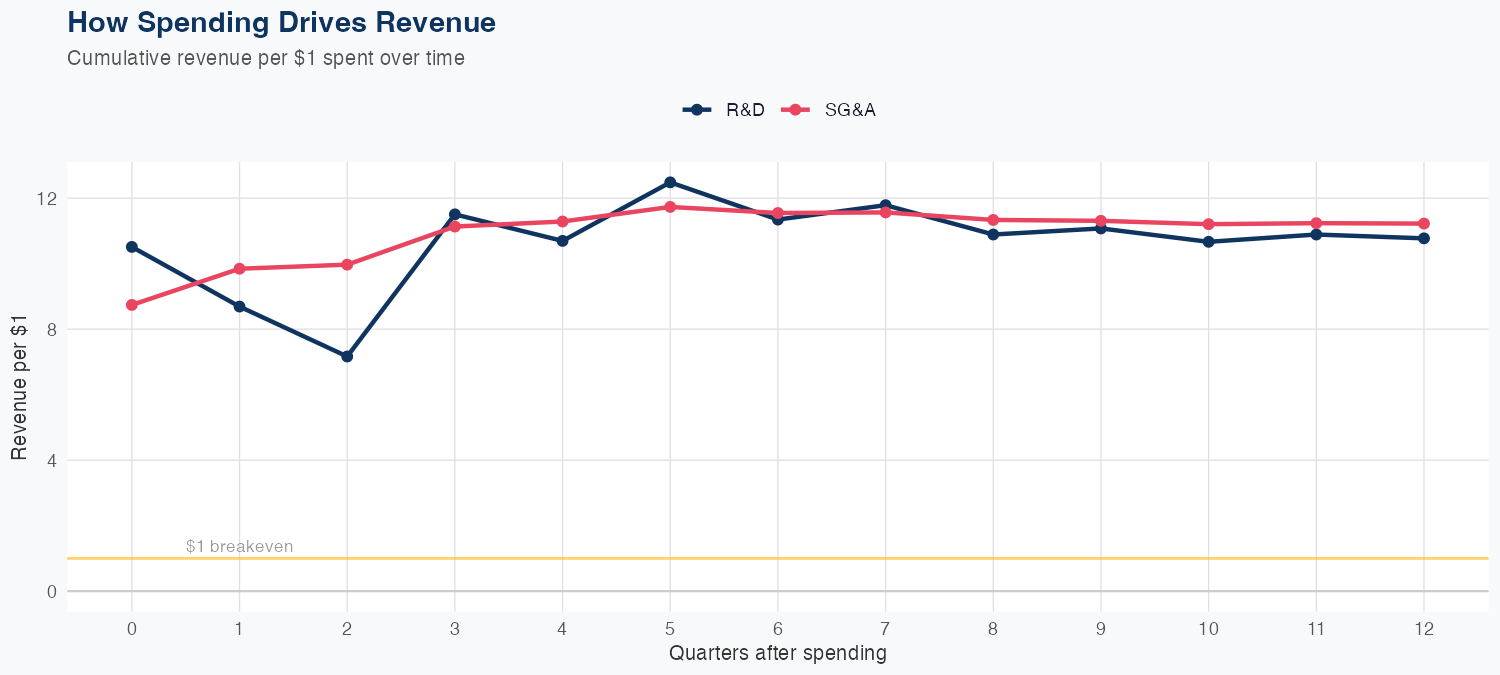
Revenue is driven by disciplined investment in R&D and SG&A, with long-run revenue returns of $10.77 per $1 spent on R&D and $11.22 per $1 spent on SG&A. The linear model, trained on 70 quarters of data, achieves 4.3% MAPE and, in holdout testing, predicted $8.1B versus actual $8.5B (5.4% error), indicating reasonable forecasting reliability. Latest quarterly revenue was $8.536B. For the full year, a forecast of about $30B revenue implies a -11.7% YoY decline, signaling a cautious near-term outlook with potential upside from efficiency gains or cyclical recovery.
Investment Thesis
The econometric model achieves strong accuracy (4.3% MAPE), suggesting Cummins Inc.'s revenue trajectory is well-characterized by its spending patterns. Every $1 of R&D investment is associated with $10.77 of revenue, indicating efficient capital deployment in innovation. Each $1 of SG&A spending generates $11.22 in revenue, reflecting strong commercial efficiency.
Revenue Forecast
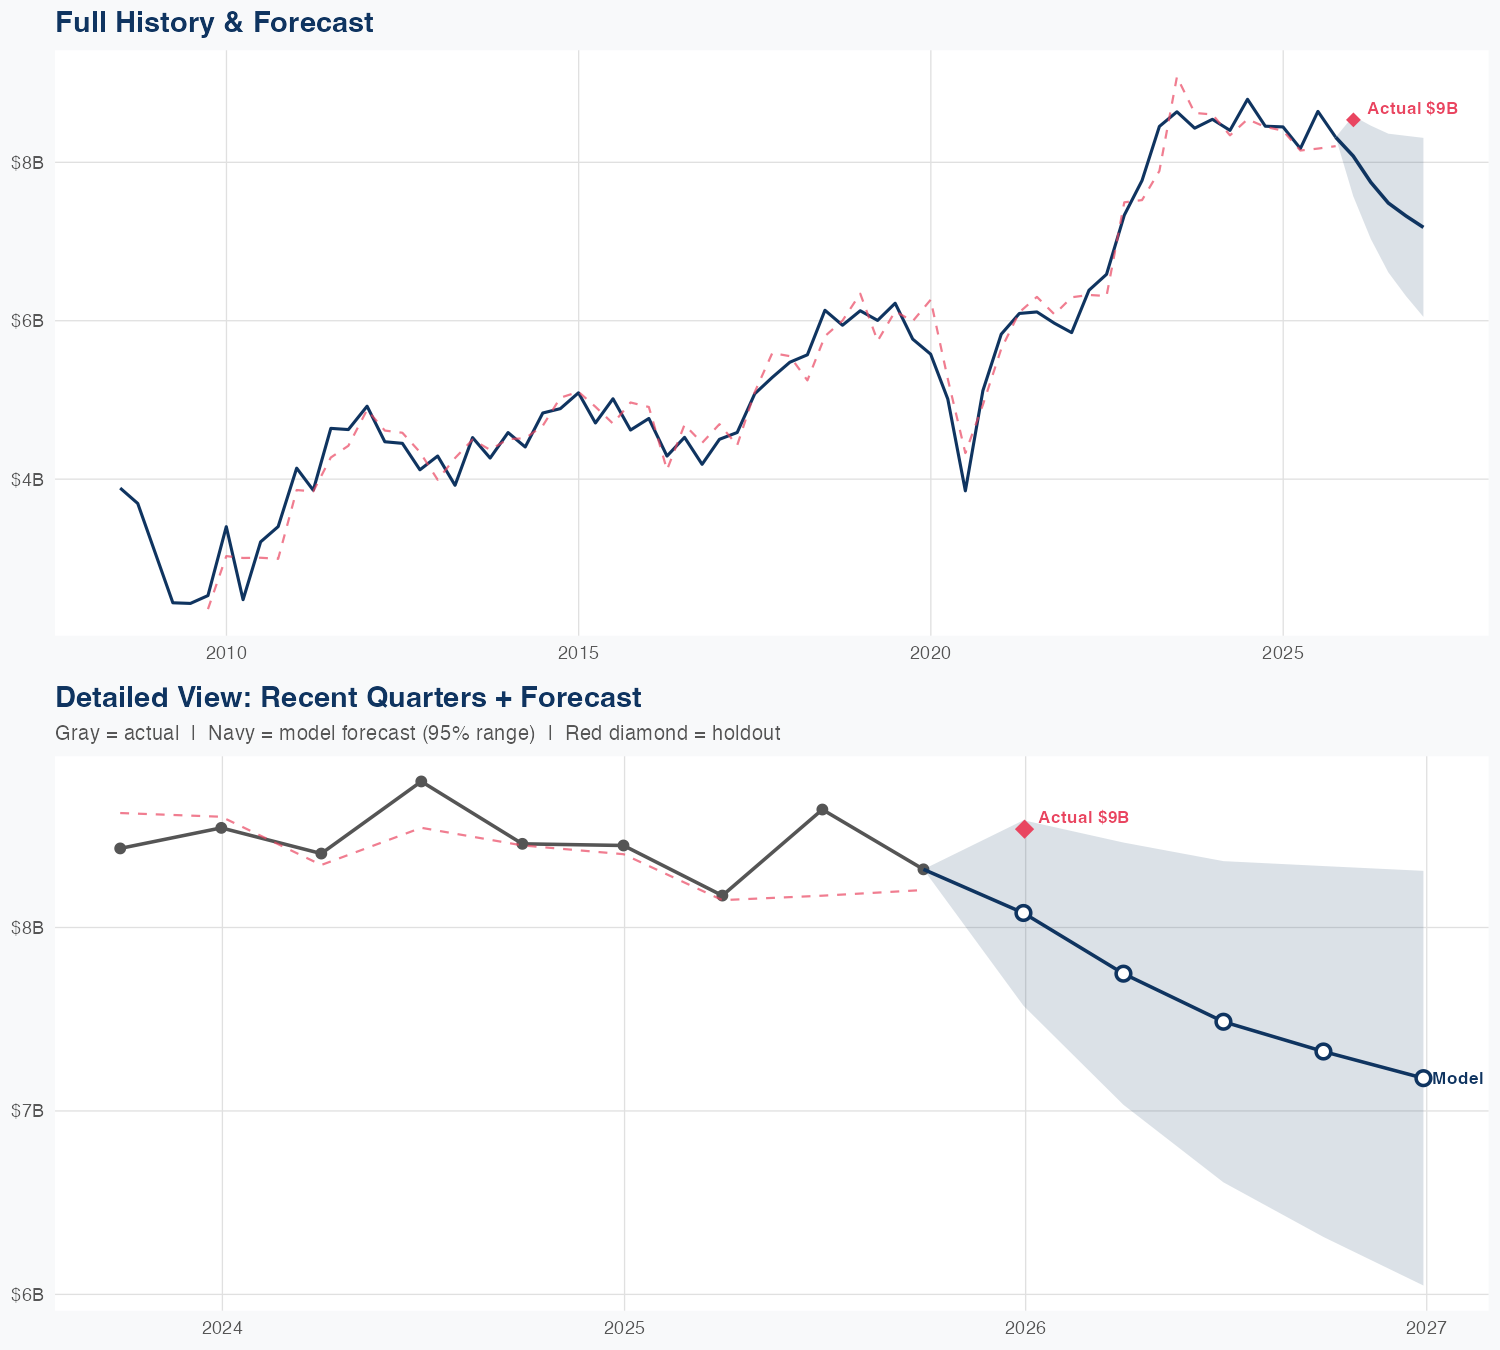
Quarterly Detail
| Quarter | Model Forecast | Actual | 95% Range | YoY Growth | Status |
|---|---|---|---|---|---|
| Q4 2025 | $8.1B | $8.5B | $7.6B – $8.6B | -4.4% | ✓ In range |
| Q1 2026 | $7.7B | $7.0B – $8.5B | -5.2% | ||
| Q2 2026 | $7.5B | $6.6B – $8.4B | -13.4% | ||
| Q3 2026 | $7.3B | $6.3B – $8.3B | -11.9% | ||
| Q4 2026 | $7.2B | $6.0B – $8.3B | -15.9% |
Seasonal Factors
| Fiscal Quarter | Seasonal Factor | vs Trend | Interpretation | Obs. |
|---|---|---|---|---|
| FQ1 (Sep–Nov) | 0.9784 | -2.2% | In line with trend | 17 |
| FQ2 (Dec–Feb) | 1.0057 | +0.6% | In line with trend | 17 |
| FQ3 (Mar–May) | 1.0038 | +0.4% | In line with trend | 16 |
| FQ4 (Jun–Aug) | 1.0296 | +3.0% | In line with trend | 16 |
How Spending Drives Revenue
Want this analysis for your portfolio?
I build custom revenue intelligence reports for investors and companies using SEC filing data, econometric modeling, and AI-powered insights.
Get in Touch