Coinbase Global, Inc. COIN
Revenue Intelligence Report • 24 quarters of SEC filing data • Updated 2026-03-15
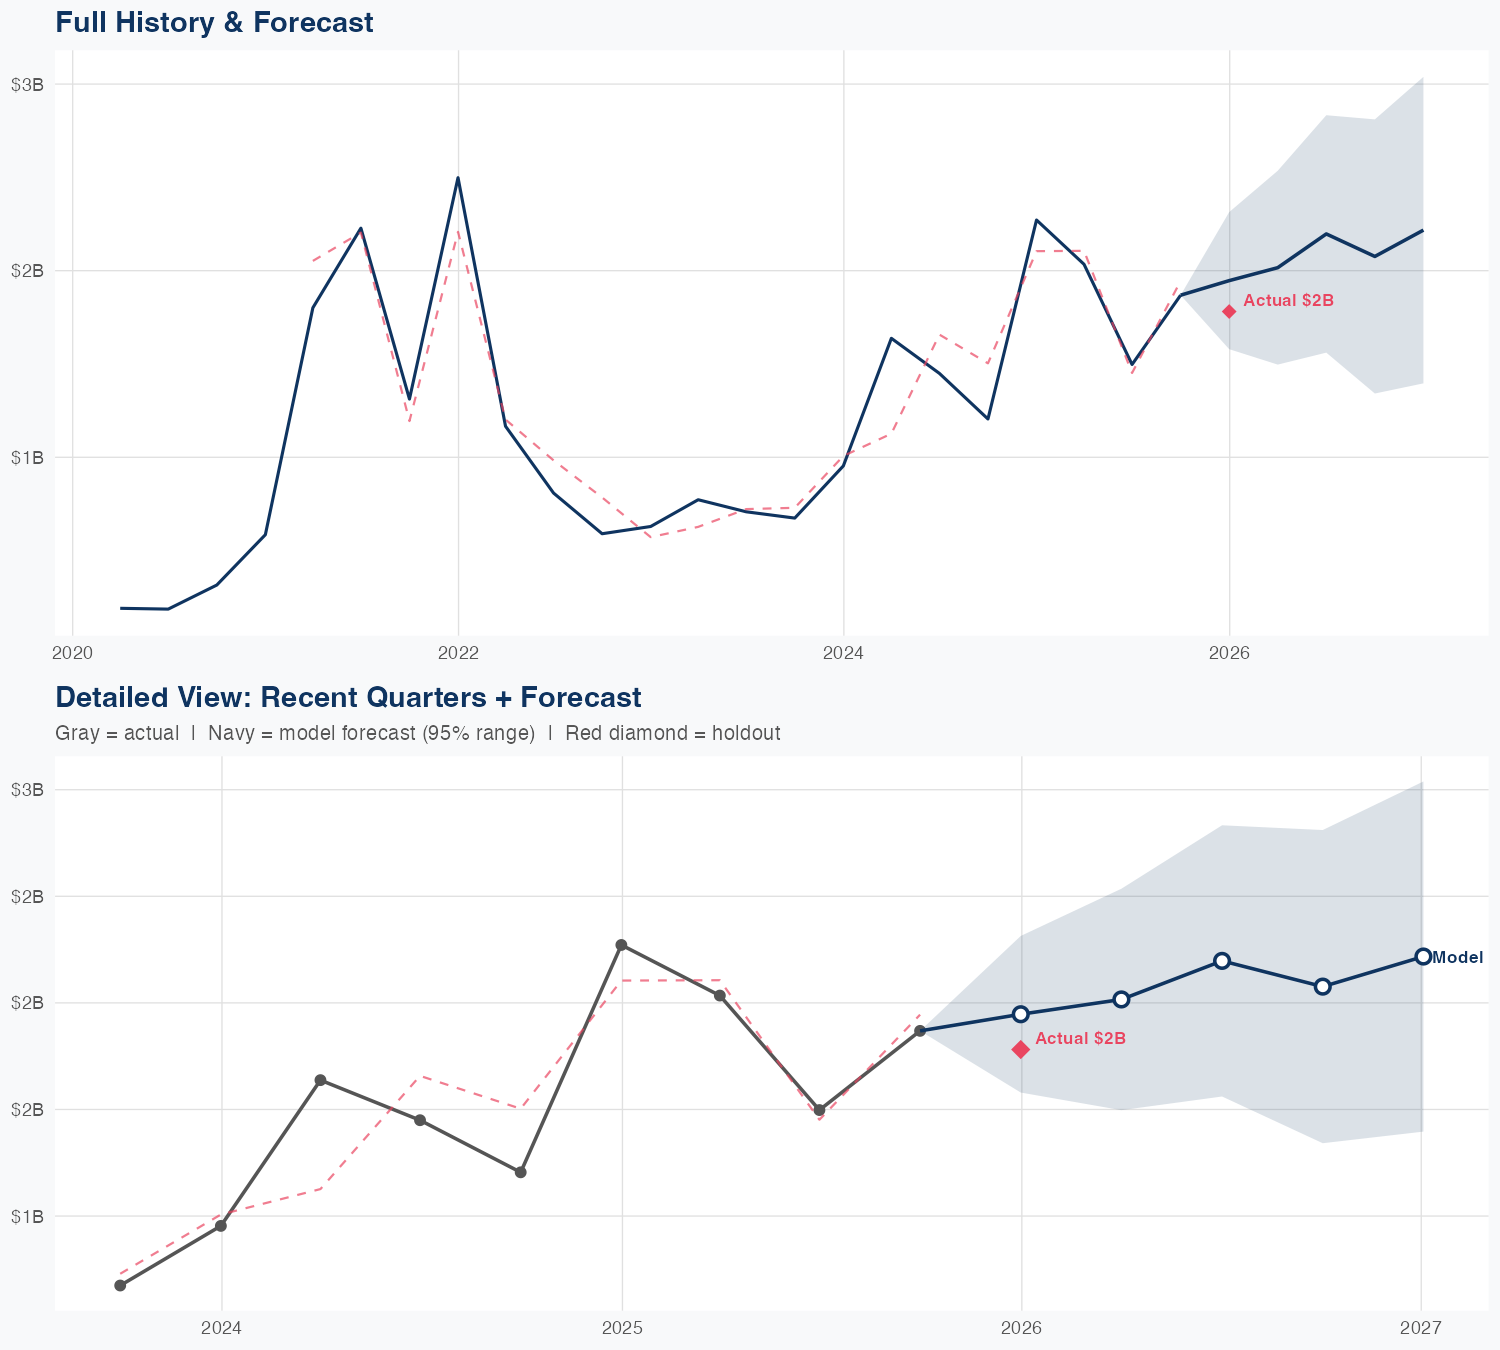
Within a log-log framework, revenue sensitivity favors cost structure over R&D intensity: a 1% increase in R&D is associated with a 1.26% decline in revenue, while a 1% rise in SG&A correlates with a 0.21% revenue uptick. The model shows moderate accuracy (12.5% MAPE) and a holdout miss of -17.8% (actual $1.8B vs forecast $2.1B), highlighting substantial forecast uncertainty. The management forecast targets about $10B in revenue for the year, up roughly 46% year over year, implying a meaningful growth path albeit with elevated model risk around near-term expectations. Given the negative R&D elasticity, investors should scrutinize how R&D translates into monetizable product outcomes and consider SG&A effectiveness and potential lag effects when evaluating ROI and the sustainability of the outlook.
Investment Thesis
At 12.5% MAPE, the model captures Coinbase Global, Inc.'s broad revenue trajectory, though quarterly variability suggests sensitivity to external factors. R&D spending currently shows a negative elasticity (-1.26x), which can indicate heavy investment in long-cycle initiatives not yet reflected in revenue. Sales & marketing spend shows a 0.21x elasticity, suggesting effective go-to-market execution.
Revenue Forecast
Quarterly Detail
| Quarter | Model Forecast | Actual | 95% Range | YoY Growth | Status |
|---|---|---|---|---|---|
| Q4 2025 | $2.1B | $1.8B | $1.5B – $2.9B | -7.7% | ✓ In range |
| Q2 2026 | $2.2B | $1.4B – $3.4B | +7.9% | ||
| Q3 2026 | $2.7B | $1.6B – $4.7B | +81.9% | ||
| Q4 2026 | $2.7B | $1.4B – $5.1B | +45.1% | ||
| Q1 2027 | $2.9B | $1.4B – $5.8B | +60.9% |
Seasonal Factors
| Fiscal Quarter | Seasonal Factor | vs Trend | Interpretation | Obs. |
|---|---|---|---|---|
| FQ1 (Sep–Nov) | 0.9012 | -9.9% | -9.9% below trend | 5 |
| FQ2 (Dec–Feb) | 1.1011 | +10.1% | +10.1% above trend | 5 |
| FQ3 (Mar–May) | 1.0731 | +7.3% | +7.3% above trend | 5 |
| FQ4 (Jun–Aug) | 0.9596 | -4.0% | -4.0% below trend | 5 |
How Spending Drives Revenue

Want this analysis for your portfolio?
I build custom revenue intelligence reports for investors and companies using SEC filing data, econometric modeling, and AI-powered insights.
Get in Touch