Chevron Corp CVX
Revenue Intelligence Report • 72 quarters of SEC filing data • Updated 2026-03-15
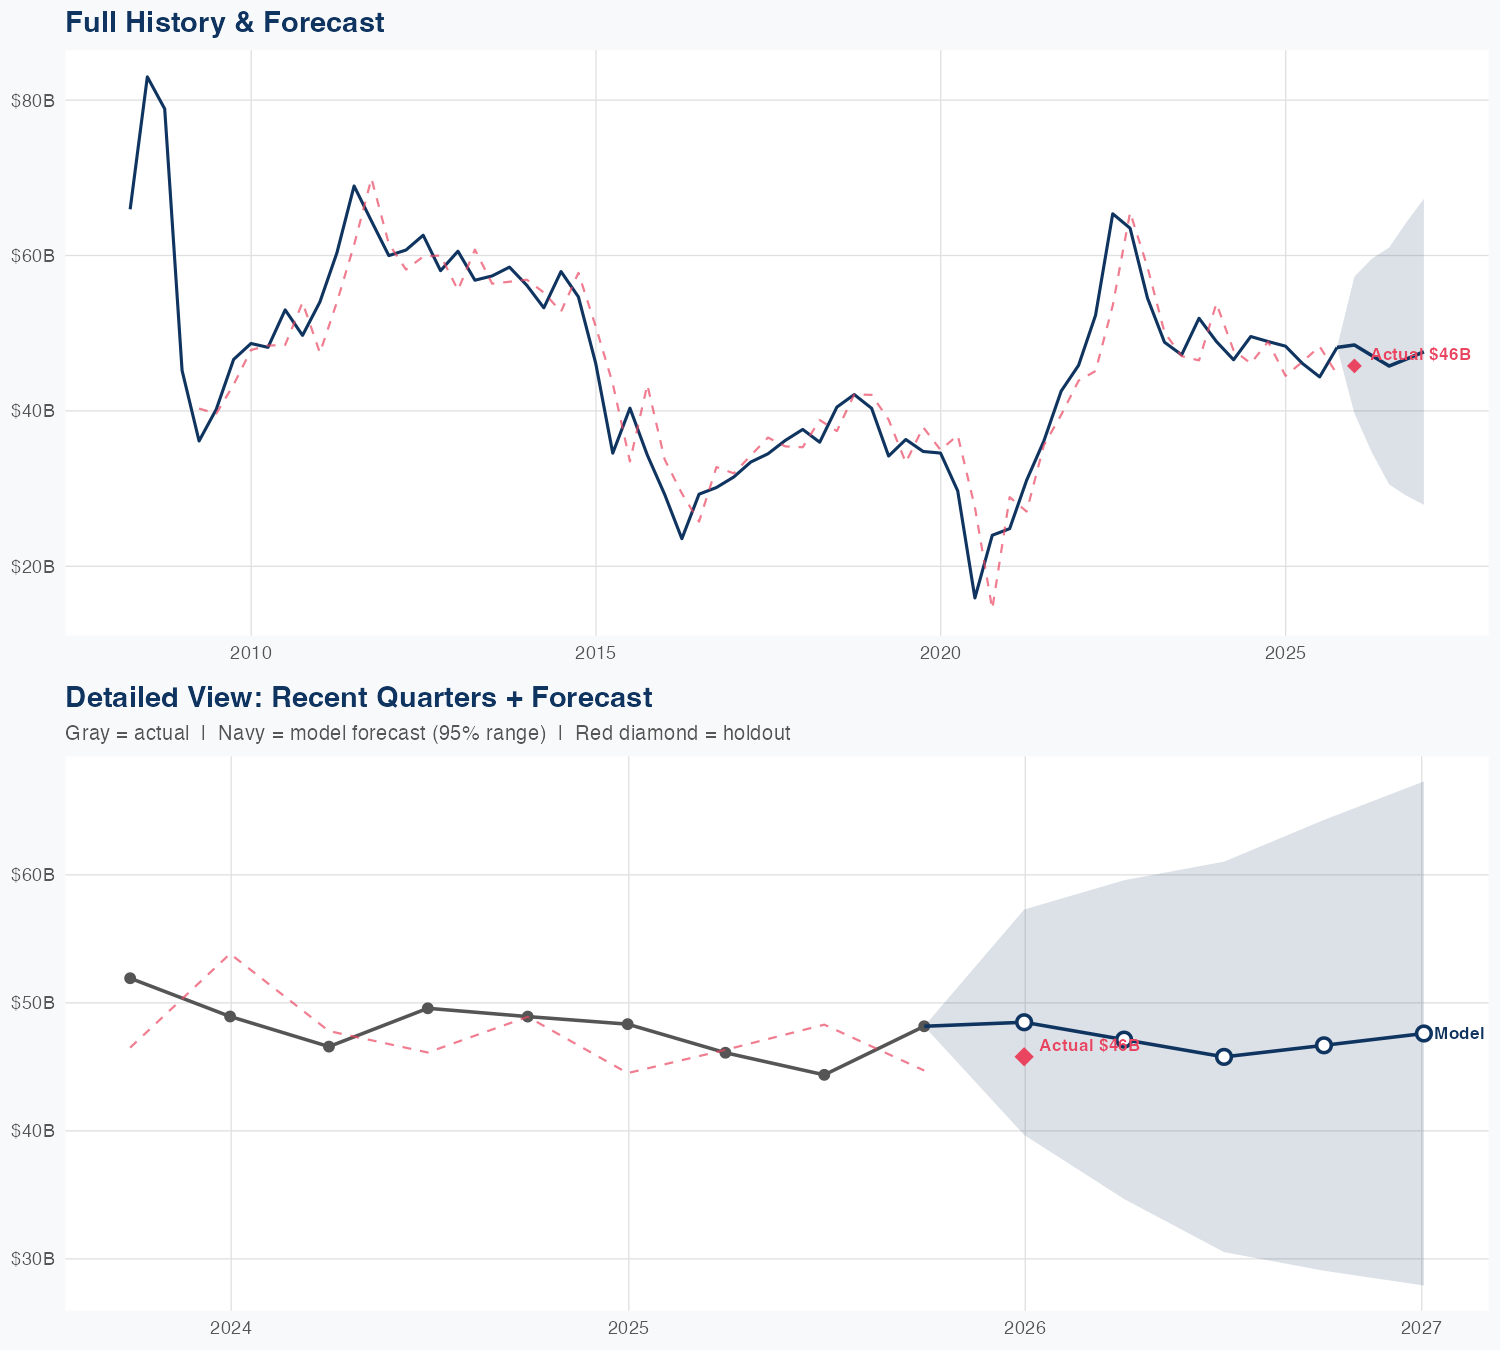
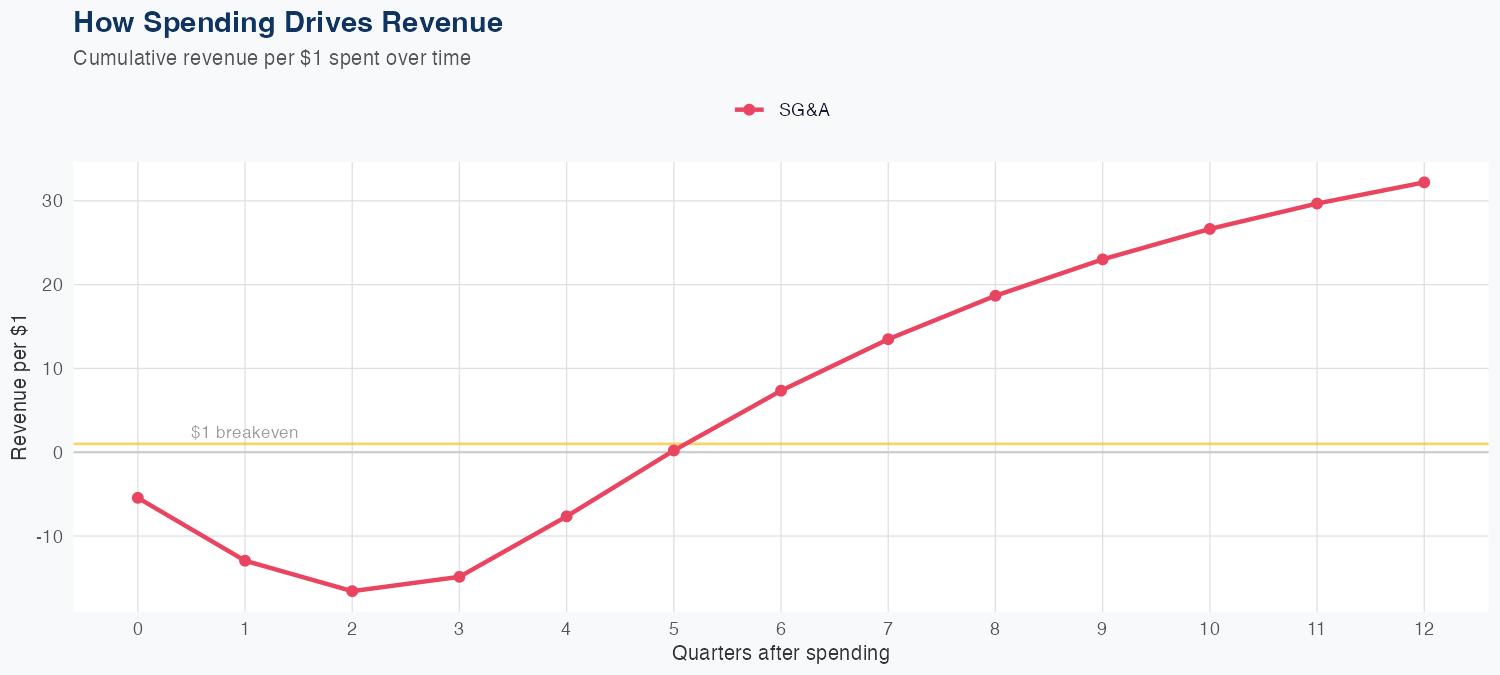
Chevron posted FY revenue of $182B, down 3.5% YoY, signaling a softer price/volume cycle. In our econometric model, fitted on 72 quarters with a linear specification and a 10.6% MAPE, SG&A efficiency stands out as an earnings lever—SG&A ROI of $10.56 per $1 implies discretionary spend translates into outsized operating progress, while growth still rides primarily on upstream economics (volume and price realization) rather than SG&A expansion. The holdout result shows a predicted $49.4B vs actual $46.9B, a 5.3% error, underscoring modest forecast reliability and the risk of mid-cycle mispricings. Key risks include commodity-price volatility, capex-driven production dynamics, and environmental/regulatory shifts that could compress earnings if prices or demand deteriorate.
Investment Thesis
At 10.6% MAPE, the model captures Chevron Corp's broad revenue trajectory, though quarterly variability suggests sensitivity to external factors. Each $1 of SG&A spending generates $10.56 in revenue, reflecting strong commercial efficiency.
Revenue Forecast
Quarterly Detail
| Quarter | Model Forecast | Actual | 95% Range | YoY Growth | Status |
|---|---|---|---|---|---|
| Q4 2025 | $49B | $47B | $39B – $59B | -5.5% | ✓ In range |
| Q2 2026 | $47B | $33B – $61B | -1.3% | ||
| Q3 2026 | $45B | $28B – $62B | +1.0% | ||
| Q4 2026 | $45B | $25B – $65B | -9.1% | ||
| Q1 2027 | $45B | $23B – $67B | -4.0% |
Seasonal Factors
| Fiscal Quarter | Seasonal Factor | vs Trend | Interpretation | Obs. |
|---|---|---|---|---|
| FQ1 (Sep–Nov) | 1.0006 | +0.1% | In line with trend | 17 |
| FQ2 (Dec–Feb) | 0.9874 | -1.3% | In line with trend | 17 |
| FQ3 (Mar–May) | 0.96 | -4.0% | -4.0% below trend | 17 |
| FQ4 (Jun–Aug) | 1.053 | +5.3% | +5.3% above trend | 17 |
How Spending Drives Revenue
Want this analysis for your portfolio?
I build custom revenue intelligence reports for investors and companies using SEC filing data, econometric modeling, and AI-powered insights.
Get in Touch