Dupont De Nemours, Inc. DD
Revenue Intelligence Report • 37 quarters of SEC filing data • Updated 2026-03-15
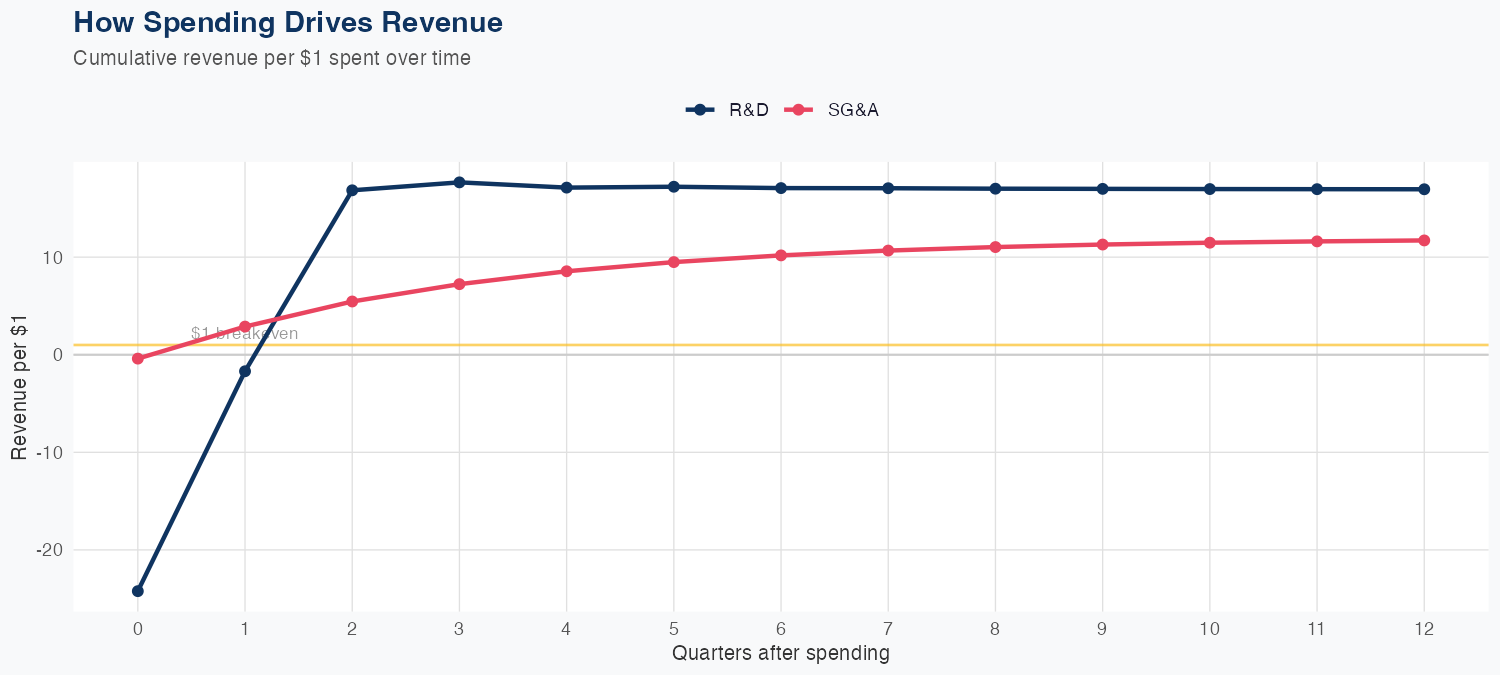
Revenue is primarily driven by R&D intensity, with an estimated long-run return of $37.95 in revenue for every $1 of R&D spending, versus $11.70 per $1 of SG&A, indicating strong leverage from R&D investments. The ROI signal favors R&D, but the underlying linear model has moderate accuracy (MAPE 33.5%), and holdout testing shows a 14.1% miss (predicted $1.9B vs actual $1.7B). The latest quarter posted about $1.693B in revenue, and the full-year forecast around $13B implies an 87.2% YoY increase, suggesting substantial expansion albeit with uncertainty. Outlook remains favorable for continued R&D-led growth and revenue expansion, but investors should monitor model accuracy and potential variability in SG&A efficiency and product-launch timing.
Investment Thesis
At 33.5% MAPE, the model captures Dupont De Nemours, Inc.'s broad revenue trajectory, though quarterly variability suggests sensitivity to external factors. Every $1 of R&D investment is associated with $37.95 of revenue, indicating efficient capital deployment in innovation. Each $1 of SG&A spending generates $11.70 in revenue, reflecting strong commercial efficiency.
Revenue Forecast
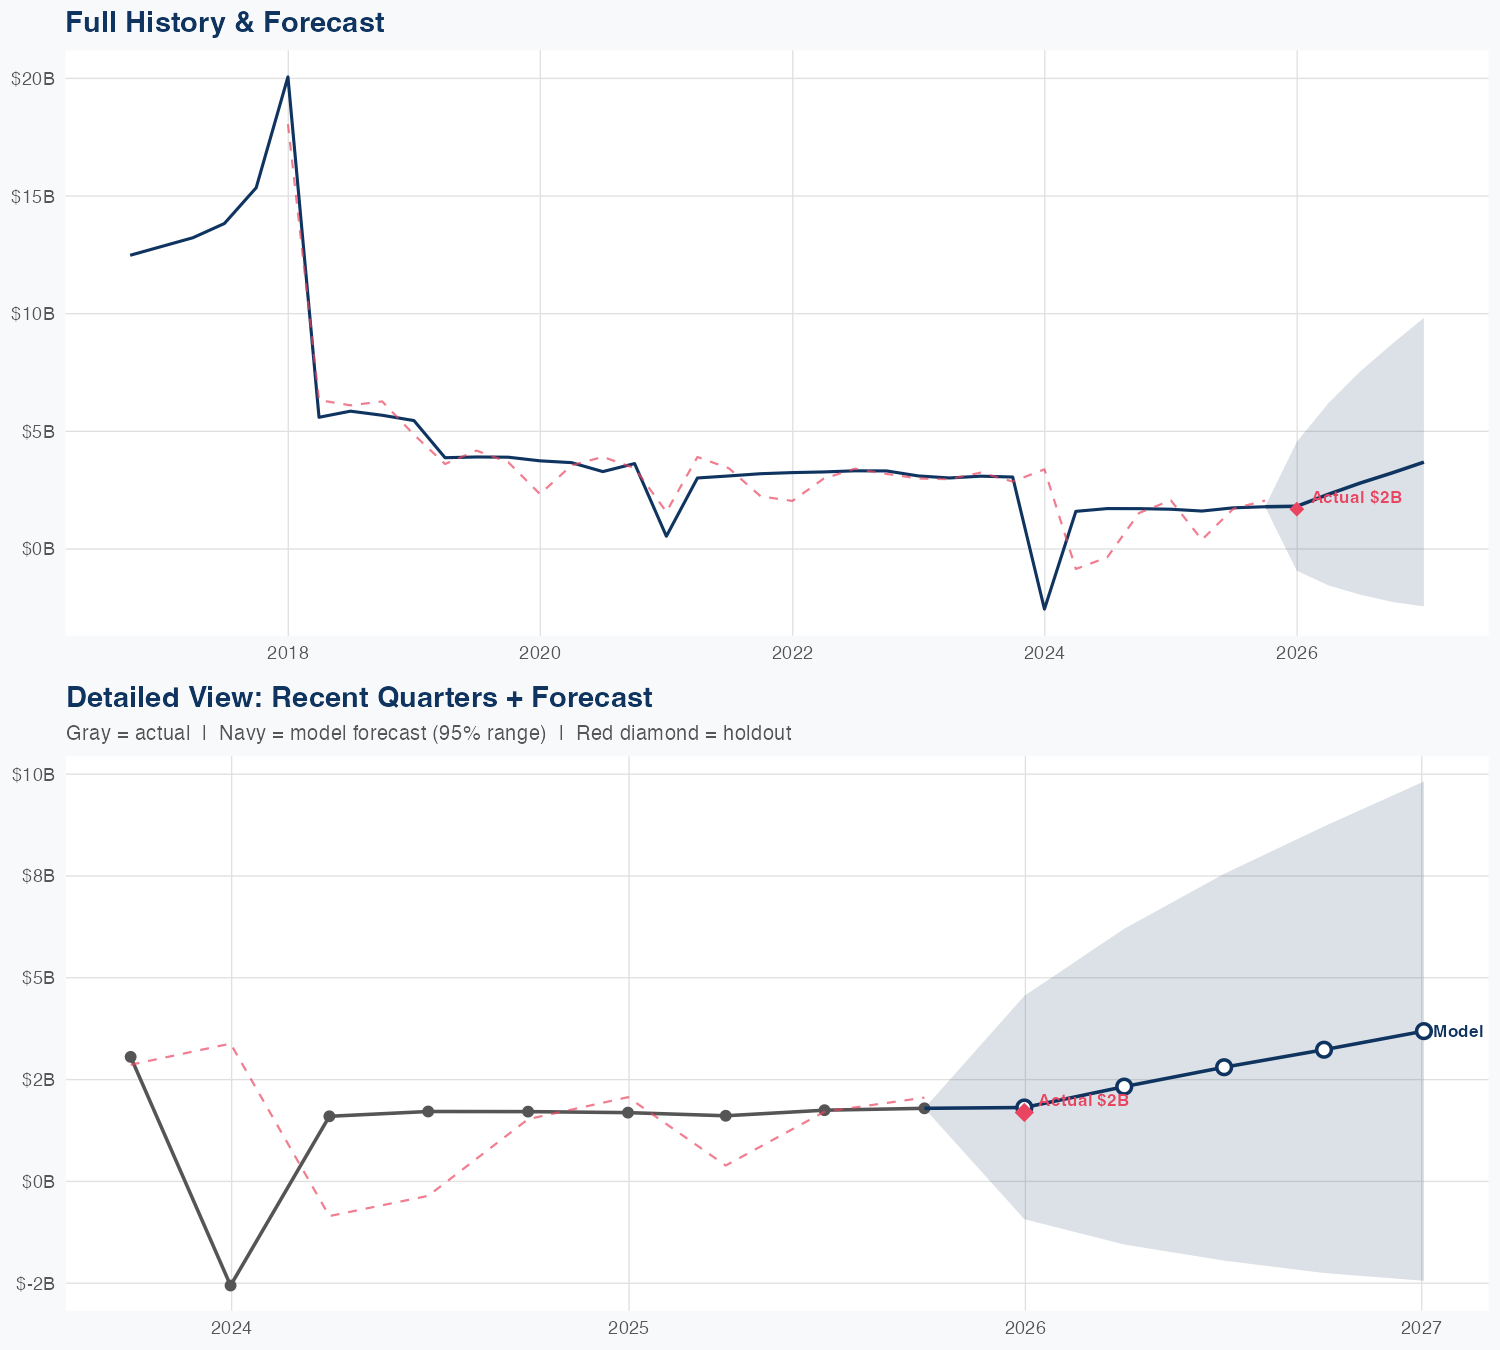
Quarterly Detail
| Quarter | Model Forecast | Actual | 95% Range | YoY Growth | Status |
|---|---|---|---|---|---|
| Q4 2025 | $1.9B | $1.7B | $-0.9B – $4.8B | +14.3% | ✓ In range |
| Q2 2026 | $2.5B | $-1.6B – $6.5B | +52.9% | ||
| Q3 2026 | $3.0B | $-2.0B – $7.9B | +69.4% | ||
| Q4 2026 | $3.4B | $-2.3B – $9.1B | +91.8% | ||
| Q1 2027 | $4.0B | $-2.4B – $10B | +133.3% |
Seasonal Factors
| Fiscal Quarter | Seasonal Factor | vs Trend | Interpretation | Obs. |
|---|---|---|---|---|
| FQ1 (Sep–Nov) | 1.0537 | +5.4% | +5.4% above trend | 8 |
| FQ2 (Dec–Feb) | 1.0067 | +0.7% | In line with trend | 9 |
| FQ3 (Mar–May) | 1.0487 | +4.9% | +4.9% above trend | 7 |
| FQ4 (Jun–Aug) | 0.9424 | -5.8% | -5.8% below trend | 7 |
How Spending Drives Revenue
Want this analysis for your portfolio?
I build custom revenue intelligence reports for investors and companies using SEC filing data, econometric modeling, and AI-powered insights.
Get in Touch