Dell Technologies Inc. DELL
Revenue Intelligence Report • 34 quarters of SEC filing data • Updated 2026-03-15
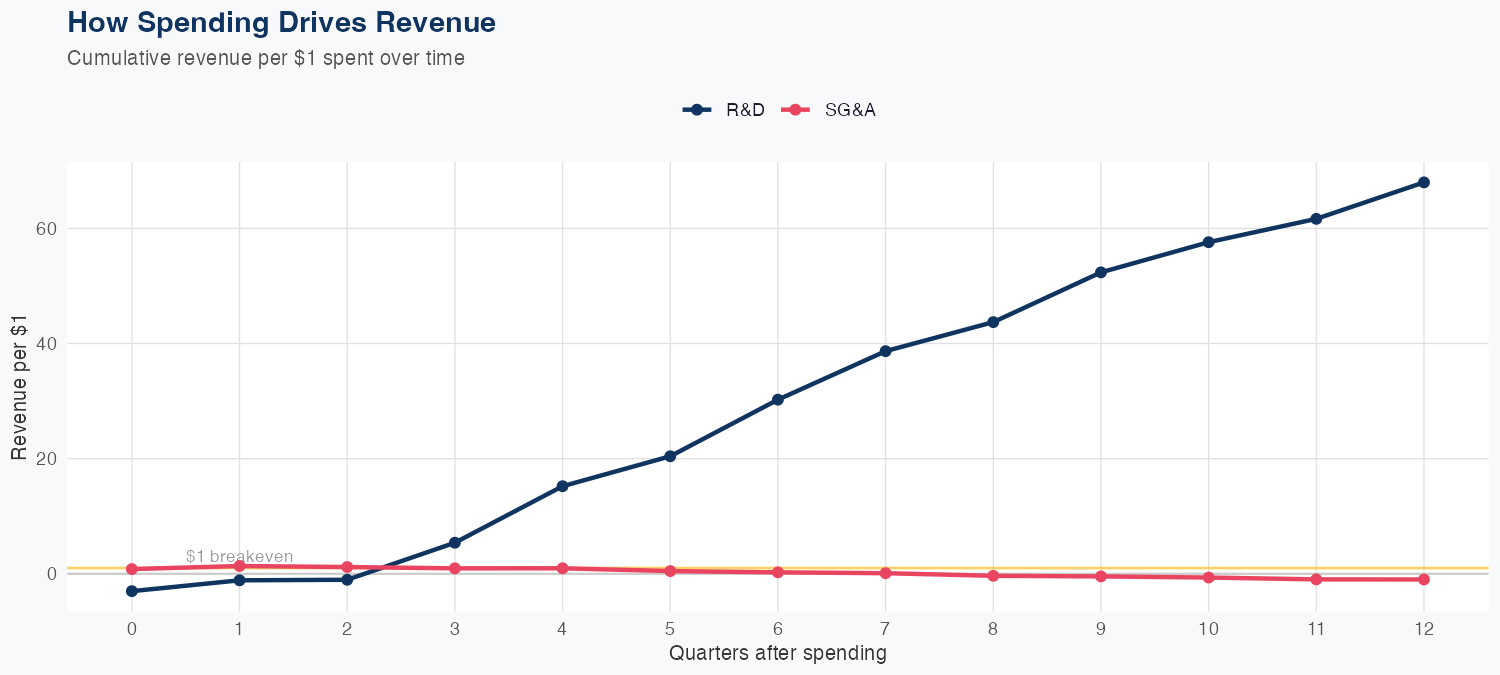
Our econometric model suggests Dell's 136B revenue and 30% YoY growth are being driven primarily by R&D-enabled product cycles and enterprise solutions, with R&D delivering an ROI of 68 dollars of revenue per dollar invested. SG&A ROI is negative (-0.99 per $1), indicating that incremental SG&A spend is not translating into proportional revenue and may reflect fixed-cost absorption or discounting rather than top-line lift. Holdout prediction came in at 27.9B vs actual 27.0B (3.4% error) and the 4.2% MAPE signals reasonably reliable forecasts but still some near-term risk. Growth is most sensitive to hardware/IT cycle dynamics and competitive pricing; a softer enterprise IT cycle or slower payoff from R&D could temper upside and pressure margins if SG&A remains a larger share of revenue.
Investment Thesis
The econometric model achieves strong accuracy (4.2% MAPE), suggesting Dell Technologies Inc.'s revenue trajectory is well-characterized by its spending patterns. Every $1 of R&D investment is associated with $68.00 of revenue, indicating efficient capital deployment in innovation.
Revenue Forecast
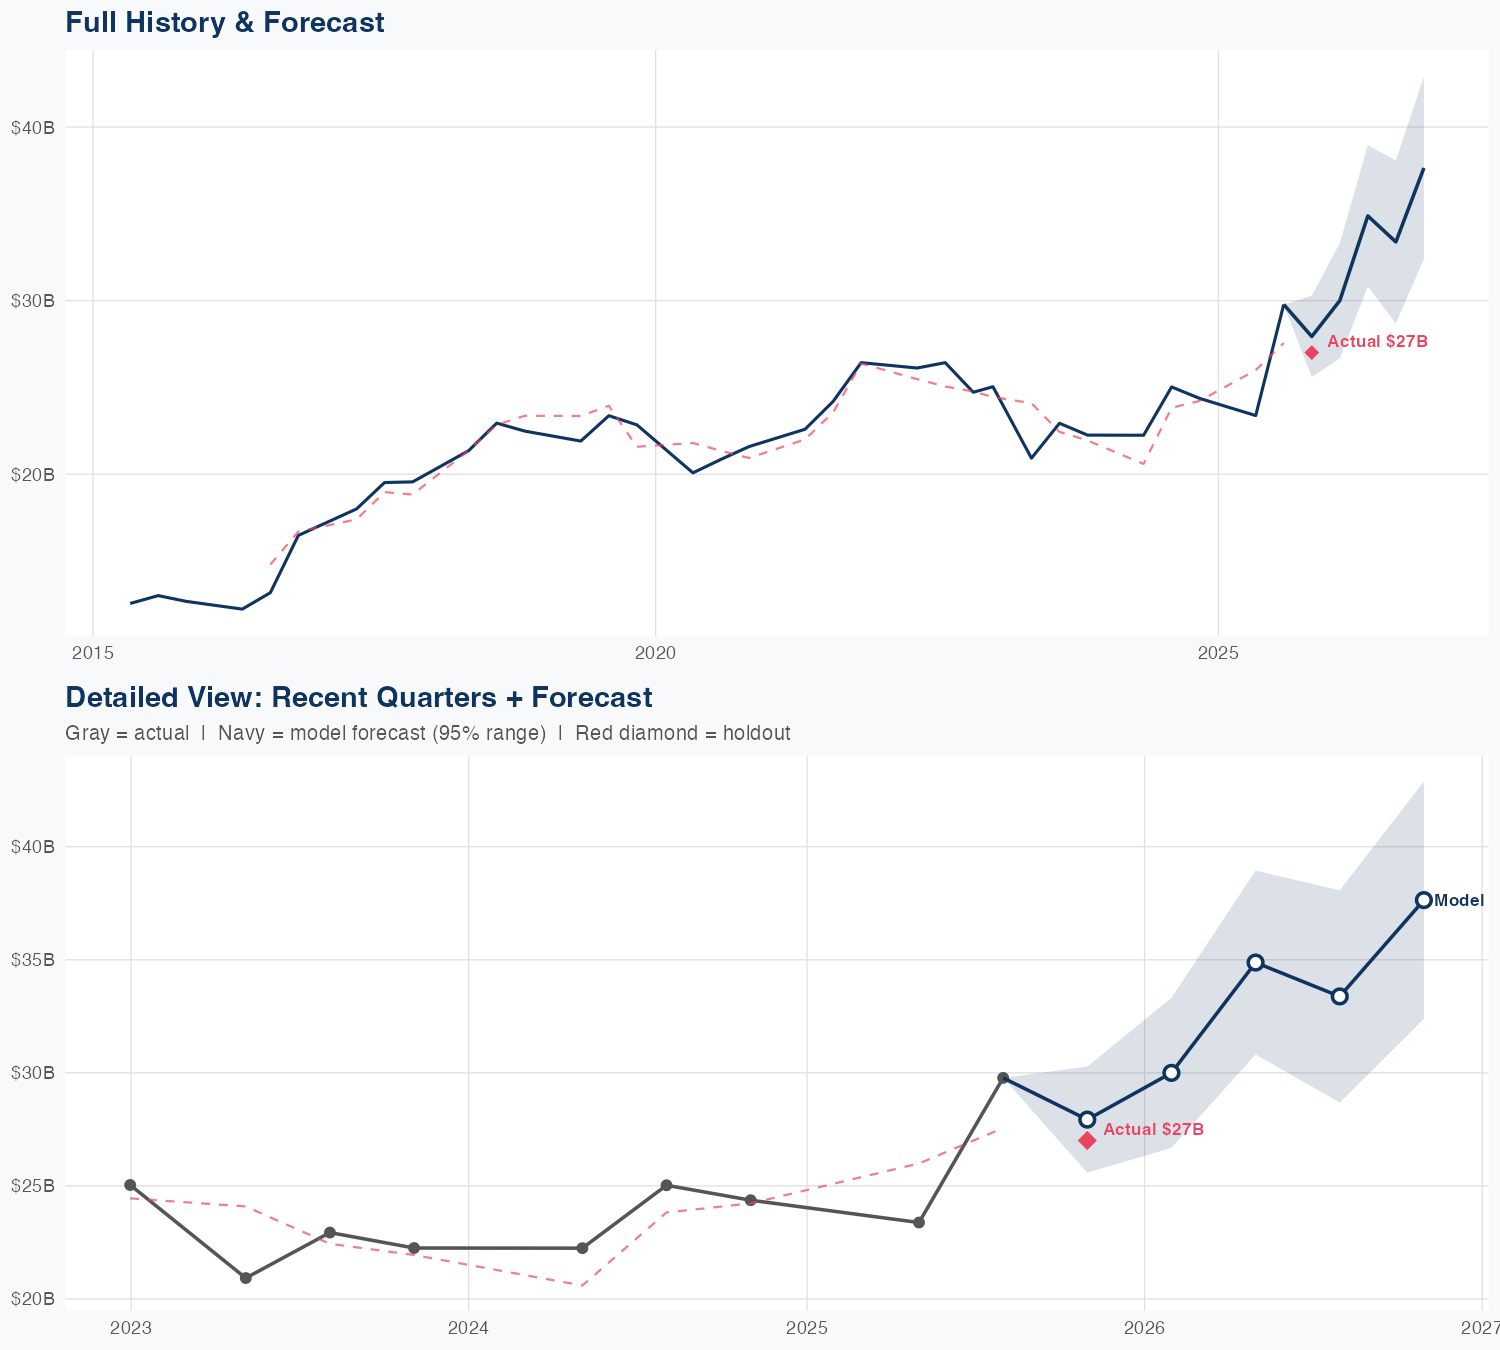
Quarterly Detail
| Quarter | Model Forecast | Actual | 95% Range | YoY Growth | Status |
|---|---|---|---|---|---|
| Q4 2025 | $28B | $27B | $26B – $30B | +11.6% | ✓ In range |
| Q1 2026 | $30B | $27B – $33B | +23.1% | ||
| Q2 2026 | $35B | $31B – $39B | +49.2% | ||
| Q3 2026 | $33B | $29B – $38B | +12.1% | ||
| Q4 2026 | $38B | $32B – $43B | +39.4% |
Seasonal Factors
| Fiscal Quarter | Seasonal Factor | vs Trend | Interpretation | Obs. |
|---|---|---|---|---|
| FQ1 (Sep–Nov) | 1.0059 | +0.6% | In line with trend | 10 |
| FQ2 (Dec–Feb) | 1.0242 | +2.4% | In line with trend | 1 |
| FQ3 (Mar–May) | 0.9995 | -0.1% | In line with trend | 9 |
| FQ4 (Jun–Aug) | 1.0267 | +2.7% | In line with trend | 10 |
How Spending Drives Revenue
Want this analysis for your portfolio?
I build custom revenue intelligence reports for investors and companies using SEC filing data, econometric modeling, and AI-powered insights.
Get in Touch