Fair Isaac Corp FICO
Revenue Intelligence Report • 50 quarters of SEC filing data • Updated 2026-03-15
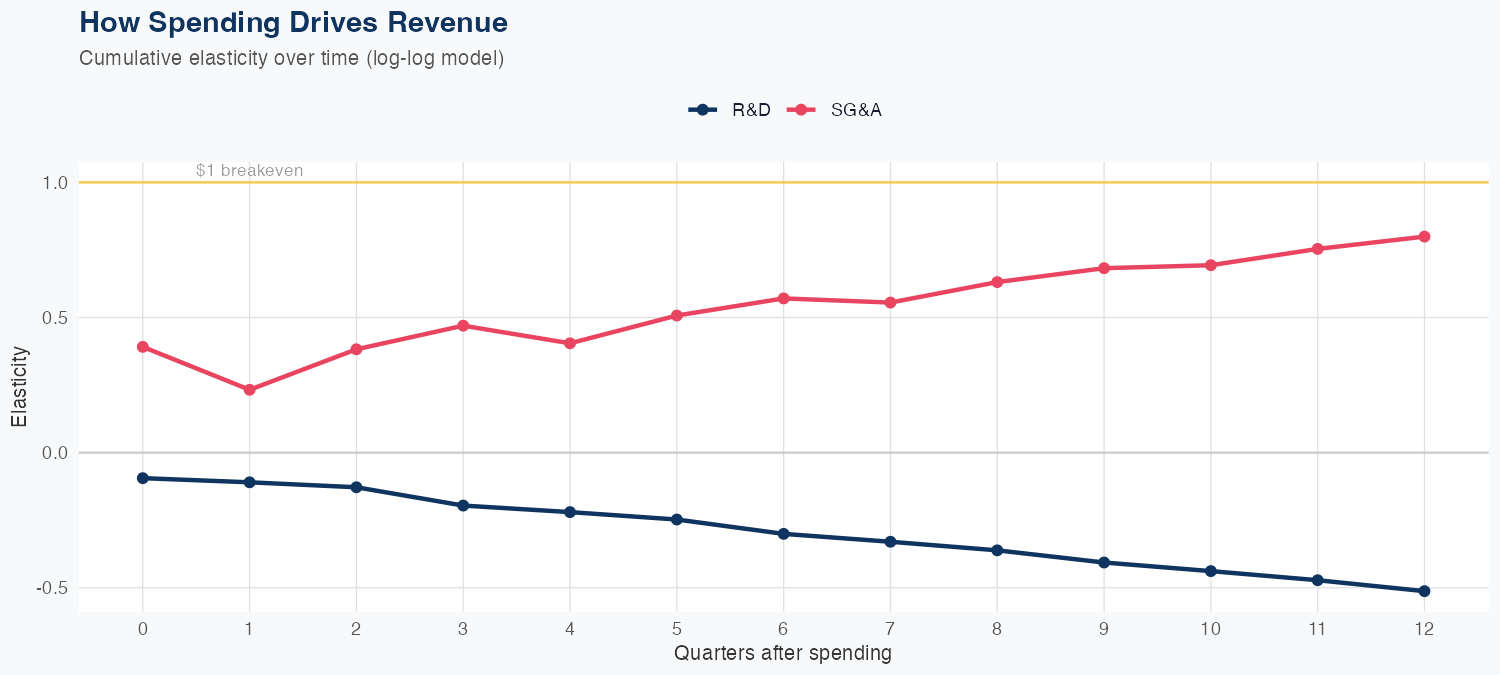
Revenue growth is driven primarily by SG&A spending, with a 1% increase in SG&A raising revenue by 0.80%, while a 1% increase in R&D reduces revenue by 0.51% in the model, implying ROI favors SG&A efficiency over R&D in the near term. The model is a log-log specification with 2.5% MAPE, and holdout testing yielded a forecast of $523M versus actual $512M, a -2.2% error, indicating solid but not perfect predictive accuracy. The FY forecast implies $2,604M in revenue, up 31.0% year over year, signaling strong top-line momentum if SG&A-driven growth persists, though the negative R&D elasticity raises questions about long-term ROI. Going forward, investors should scrutinize SG&A productivity and consider reallocating R&D to activities with clearer revenue impact to sustain the outlook.
Investment Thesis
Our ARDL model tracks Fair Isaac Corp's revenue with exceptional precision (2.5% MAPE), indicating highly predictable cash flows. R&D spending currently shows a negative elasticity (-0.51x), which can indicate heavy investment in long-cycle initiatives not yet reflected in revenue. Sales & marketing spend shows a 0.80x elasticity, suggesting effective go-to-market execution.
Revenue Forecast
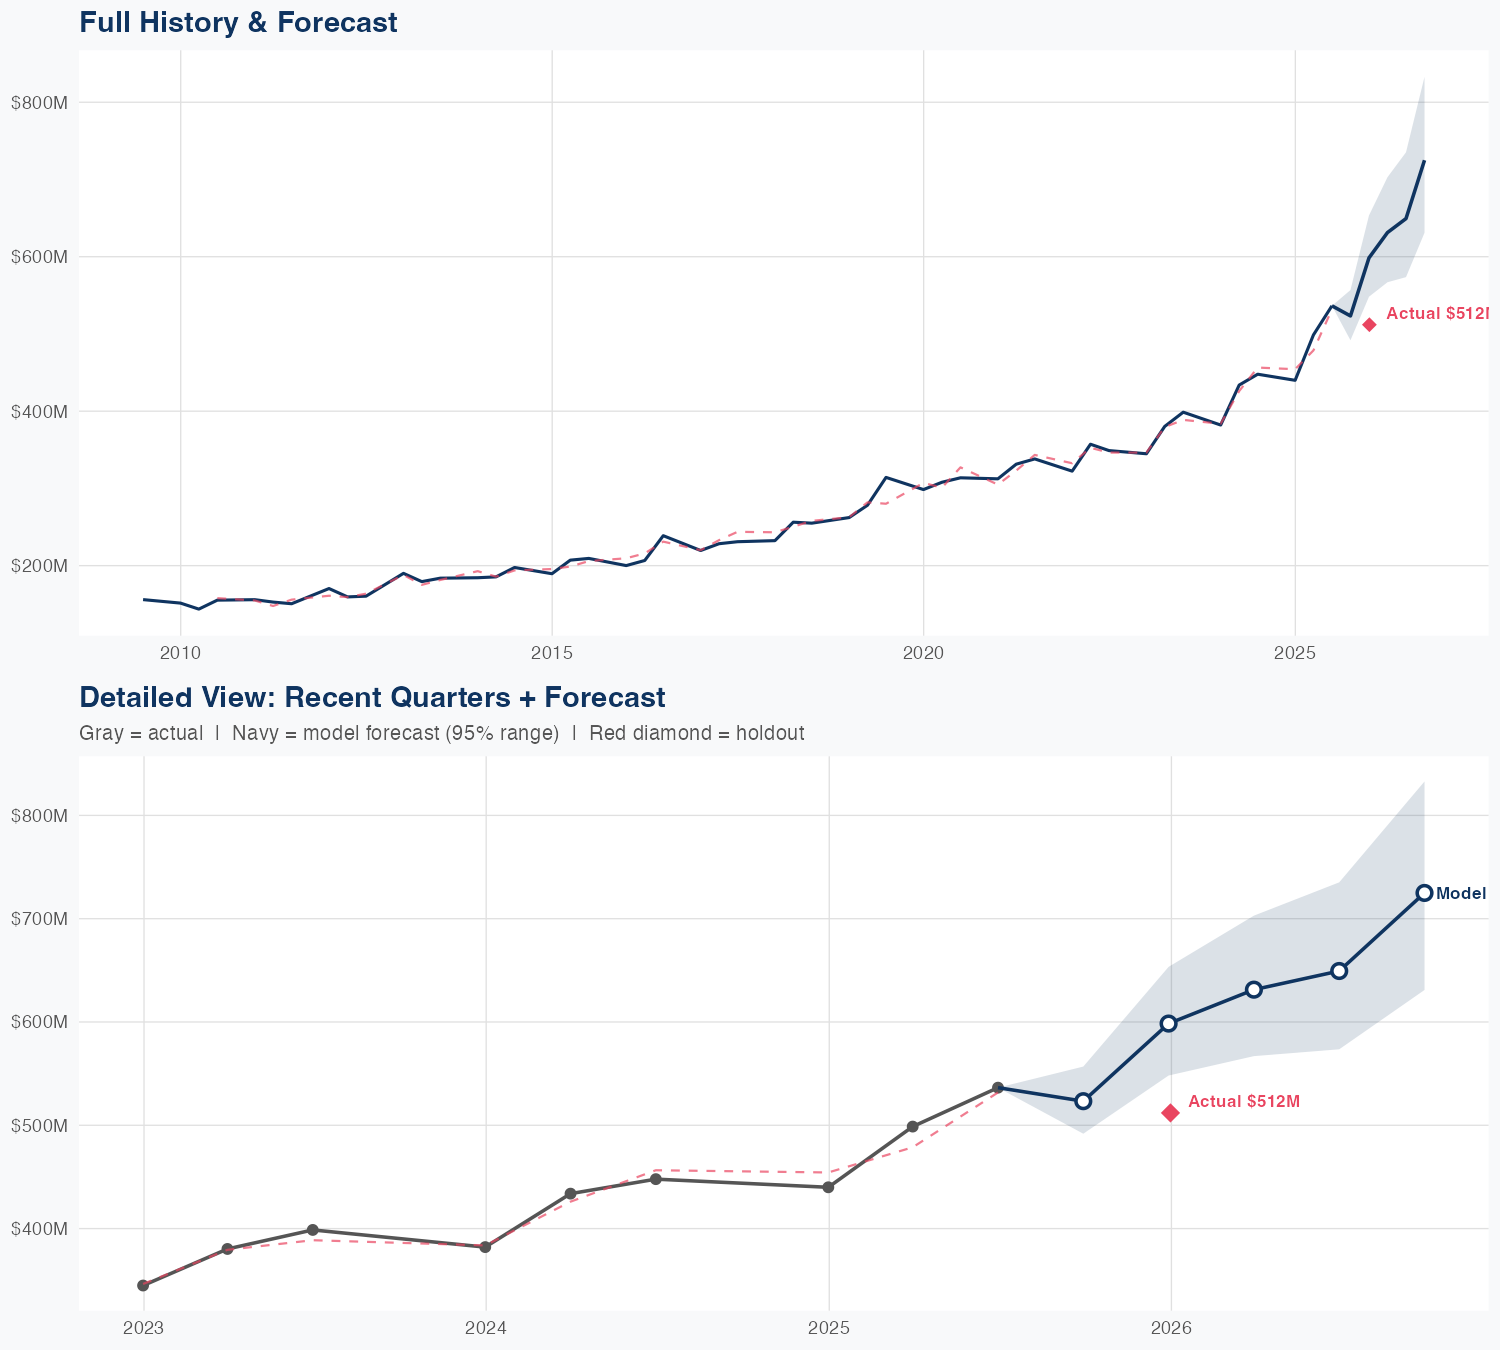
Quarterly Detail
| Quarter | Model Forecast | Actual | 95% Range | YoY Growth | Status |
|---|---|---|---|---|---|
| Q3 2025 | $523B | $512B | $492B – $557B | +16.9% | ✓ In range |
| Q4 2025 | $598B | $548B – $653B | +36.0% | ||
| Q1 2026 | $631B | $567B – $703B | +26.6% | ||
| Q2 2026 | $649B | $574B – $735B | +21.1% | ||
| Q3 2026 | $725B | $631B – $833B | +41.6% |
Seasonal Factors
| Fiscal Quarter | Seasonal Factor | vs Trend | Interpretation | Obs. |
|---|---|---|---|---|
| FQ1 (Sep–Nov) | 1.0 | +0.0% | In line with trend | 0 |
| FQ2 (Dec–Feb) | 0.9956 | -0.4% | In line with trend | 16 |
| FQ3 (Mar–May) | 1.0182 | +1.8% | In line with trend | 15 |
| FQ4 (Jun–Aug) | 1.0074 | +0.7% | In line with trend | 16 |
How Spending Drives Revenue
Want this analysis for your portfolio?
I build custom revenue intelligence reports for investors and companies using SEC filing data, econometric modeling, and AI-powered insights.
Get in Touch