General Electric Company GE
Revenue Intelligence Report • 24 quarters of SEC filing data • Updated 2026-03-15
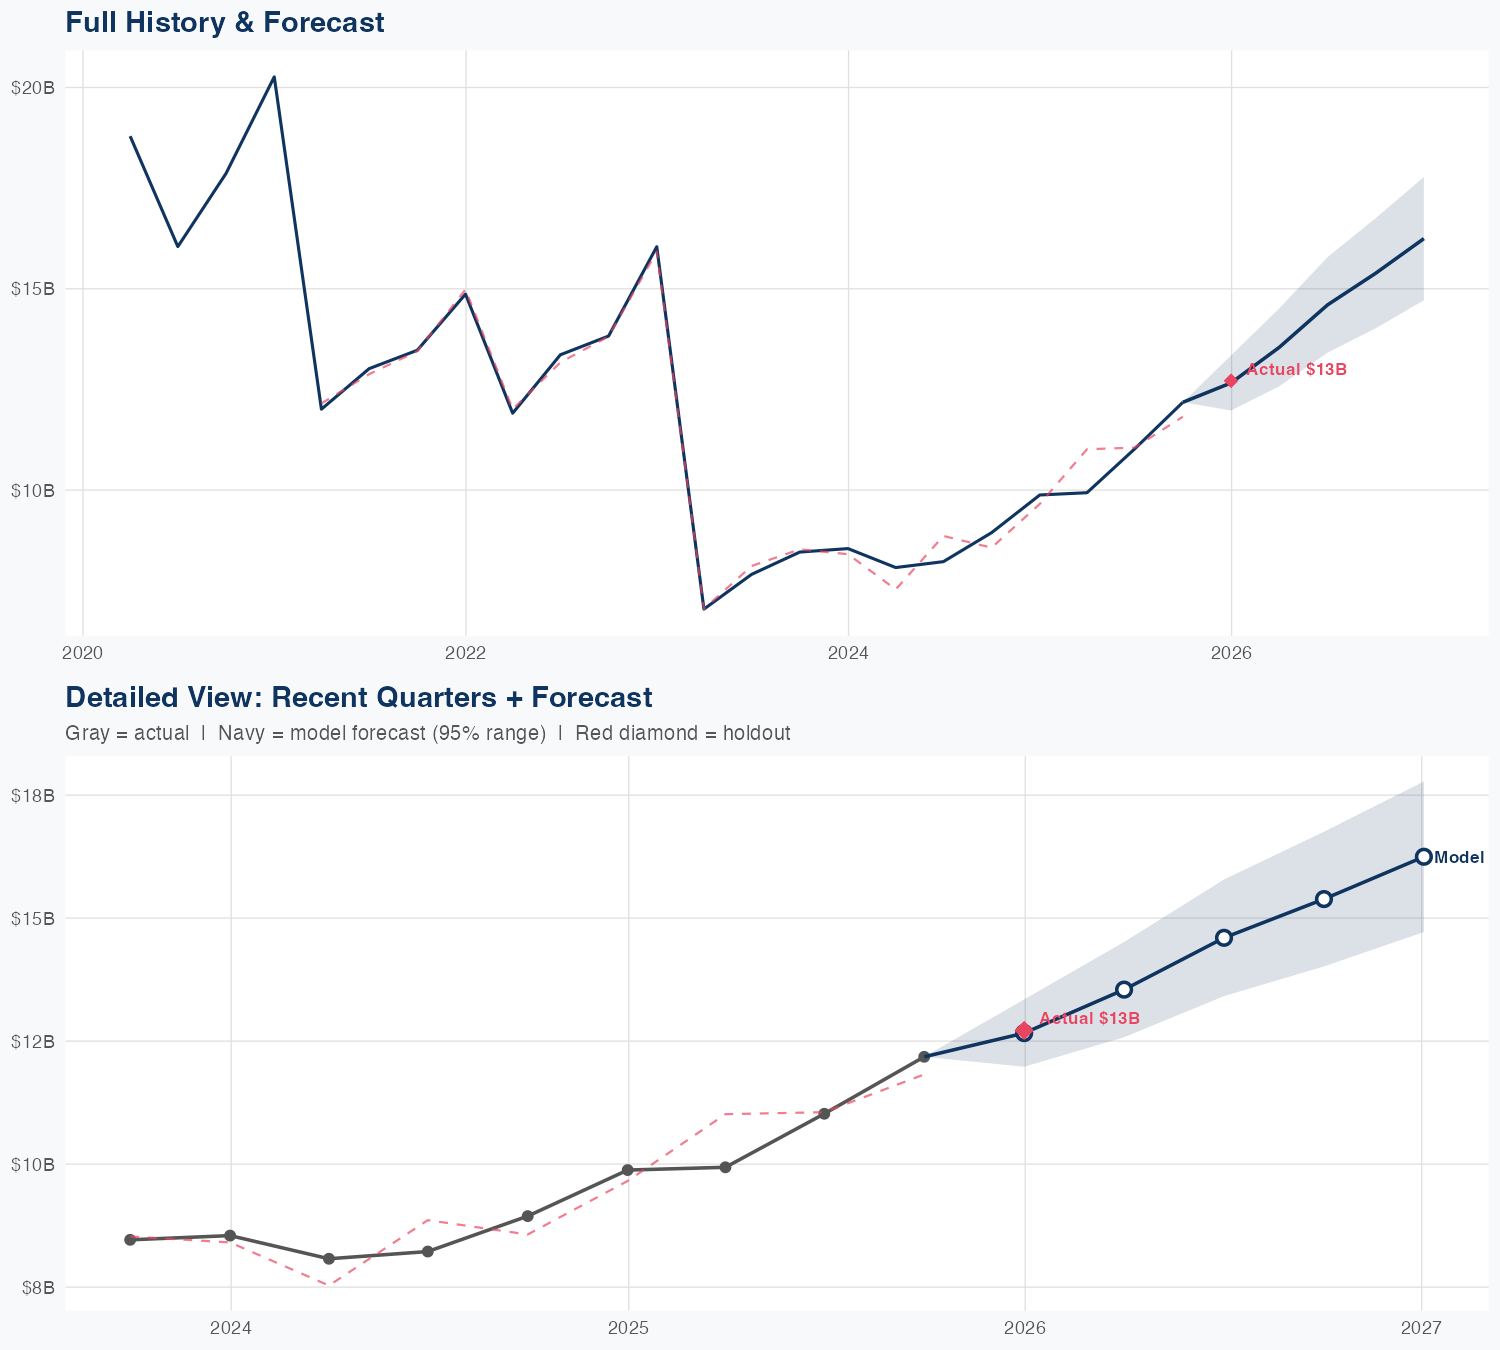
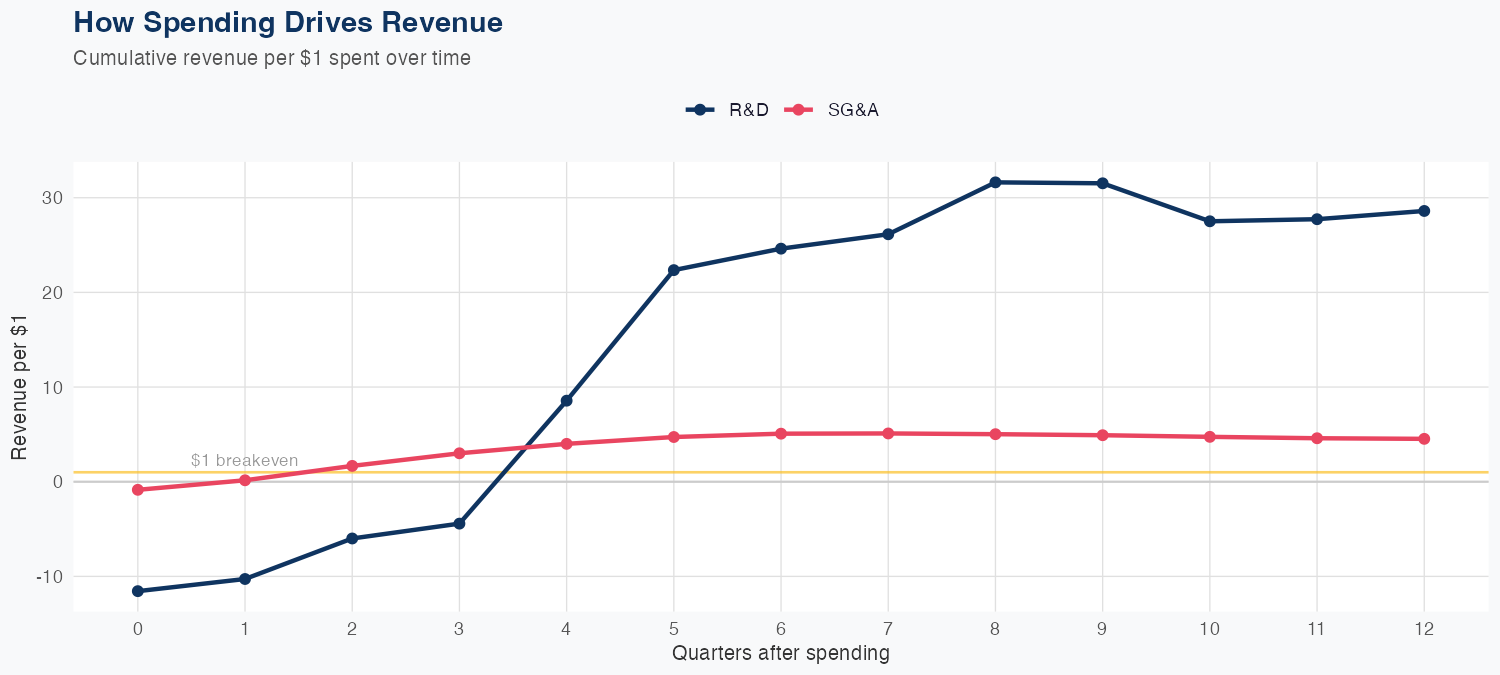
R&D spending generates about $20.70 of long-run revenue per dollar spent, compared with about $4.07 per dollar from SG&A, indicating R&D is the dominant driver of sustainable growth. Latest quarterly revenue was $12.716B, supported by a data history of 24 quarters powering a linear model. In a holdout test, the model forecast $12B versus actual $13B (4.0% error), and the overall MAPE is 2.9%, reflecting solid forecast reliability. The FY revenue forecast is $57B, up 25.0% year over year, signaling a robust, R&D-driven growth trajectory ahead.
Investment Thesis
Our ARDL model tracks General Electric Company's revenue with exceptional precision (2.9% MAPE), indicating highly predictable cash flows. Every $1 of R&D investment is associated with $20.70 of revenue, indicating efficient capital deployment in innovation. Each $1 of SG&A spending generates $4.07 in revenue, reflecting strong commercial efficiency.
Revenue Forecast
Quarterly Detail
| Quarter | Model Forecast | Actual | 95% Range | YoY Growth | Status |
|---|---|---|---|---|---|
| Q4 2025 | $12B | $13B | $11B – $13B | +12.9% | ✓ In range |
| Q2 2026 | $13B | $12B – $14B | +30.9% | ||
| Q3 2026 | $14B | $13B – $16B | +28.7% | ||
| Q4 2026 | $15B | $13B – $17B | +21.1% | ||
| Q1 2027 | $15B | $13B – $17B | +20.8% |
Seasonal Factors
| Fiscal Quarter | Seasonal Factor | vs Trend | Interpretation | Obs. |
|---|---|---|---|---|
| FQ1 (Sep–Nov) | 1.0018 | +0.2% | In line with trend | 5 |
| FQ2 (Dec–Feb) | 1.0108 | +1.1% | In line with trend | 5 |
| FQ3 (Mar–May) | 0.9947 | -0.5% | In line with trend | 5 |
| FQ4 (Jun–Aug) | 1.0087 | +0.9% | In line with trend | 5 |
How Spending Drives Revenue
Want this analysis for your portfolio?
I build custom revenue intelligence reports for investors and companies using SEC filing data, econometric modeling, and AI-powered insights.
Get in Touch