General Motors Company GM
Revenue Intelligence Report • 25 quarters of SEC filing data • Updated 2026-03-15
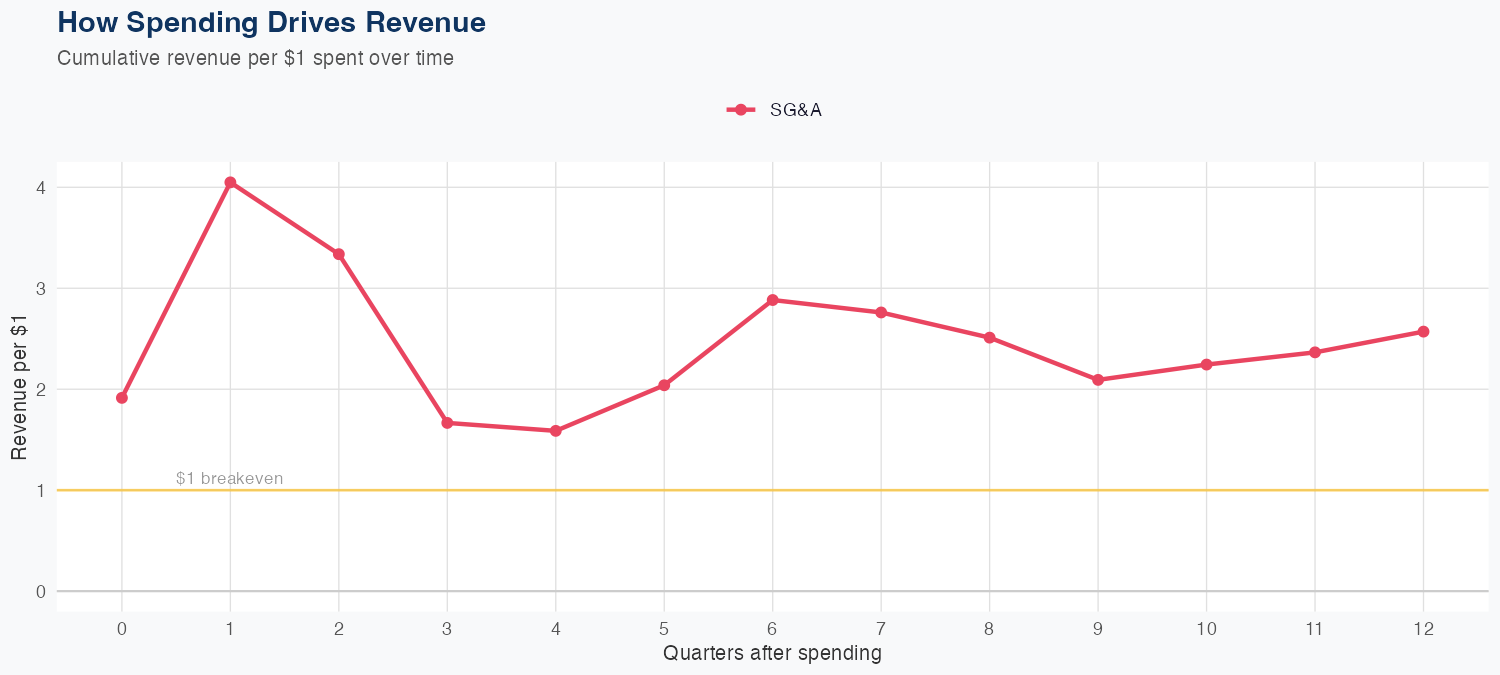
GM posted $146B in revenue, up 1.2% YoY, but our econometric model shows most near-term growth derives from scale and efficient SG&A spend rather than a surge in R&D or pricing power. SG&A ROI of $2.57 per $1 suggests strong operating leverage: incremental SG&A investment translates into outsized operating profit, implying growth comes from volume/mix enabled by cost discipline. The holdout forecast miss—38.9B predicted vs 36.8B actual, about a 5.8% error—points to limited forecast reliability in the current regime, likely from demand or supply shocks not captured by the model. Risks include a slower auto cycle, higher raw-material and incentive costs, and an accelerated EV ramp that may demand heavier capex and pressure margins if pricing or competition intensifies.
Investment Thesis
Our ARDL model tracks General Motors Company's revenue with exceptional precision (2.8% MAPE), indicating highly predictable cash flows. Each $1 of SG&A spending generates $2.57 in revenue, reflecting strong commercial efficiency.
Revenue Forecast
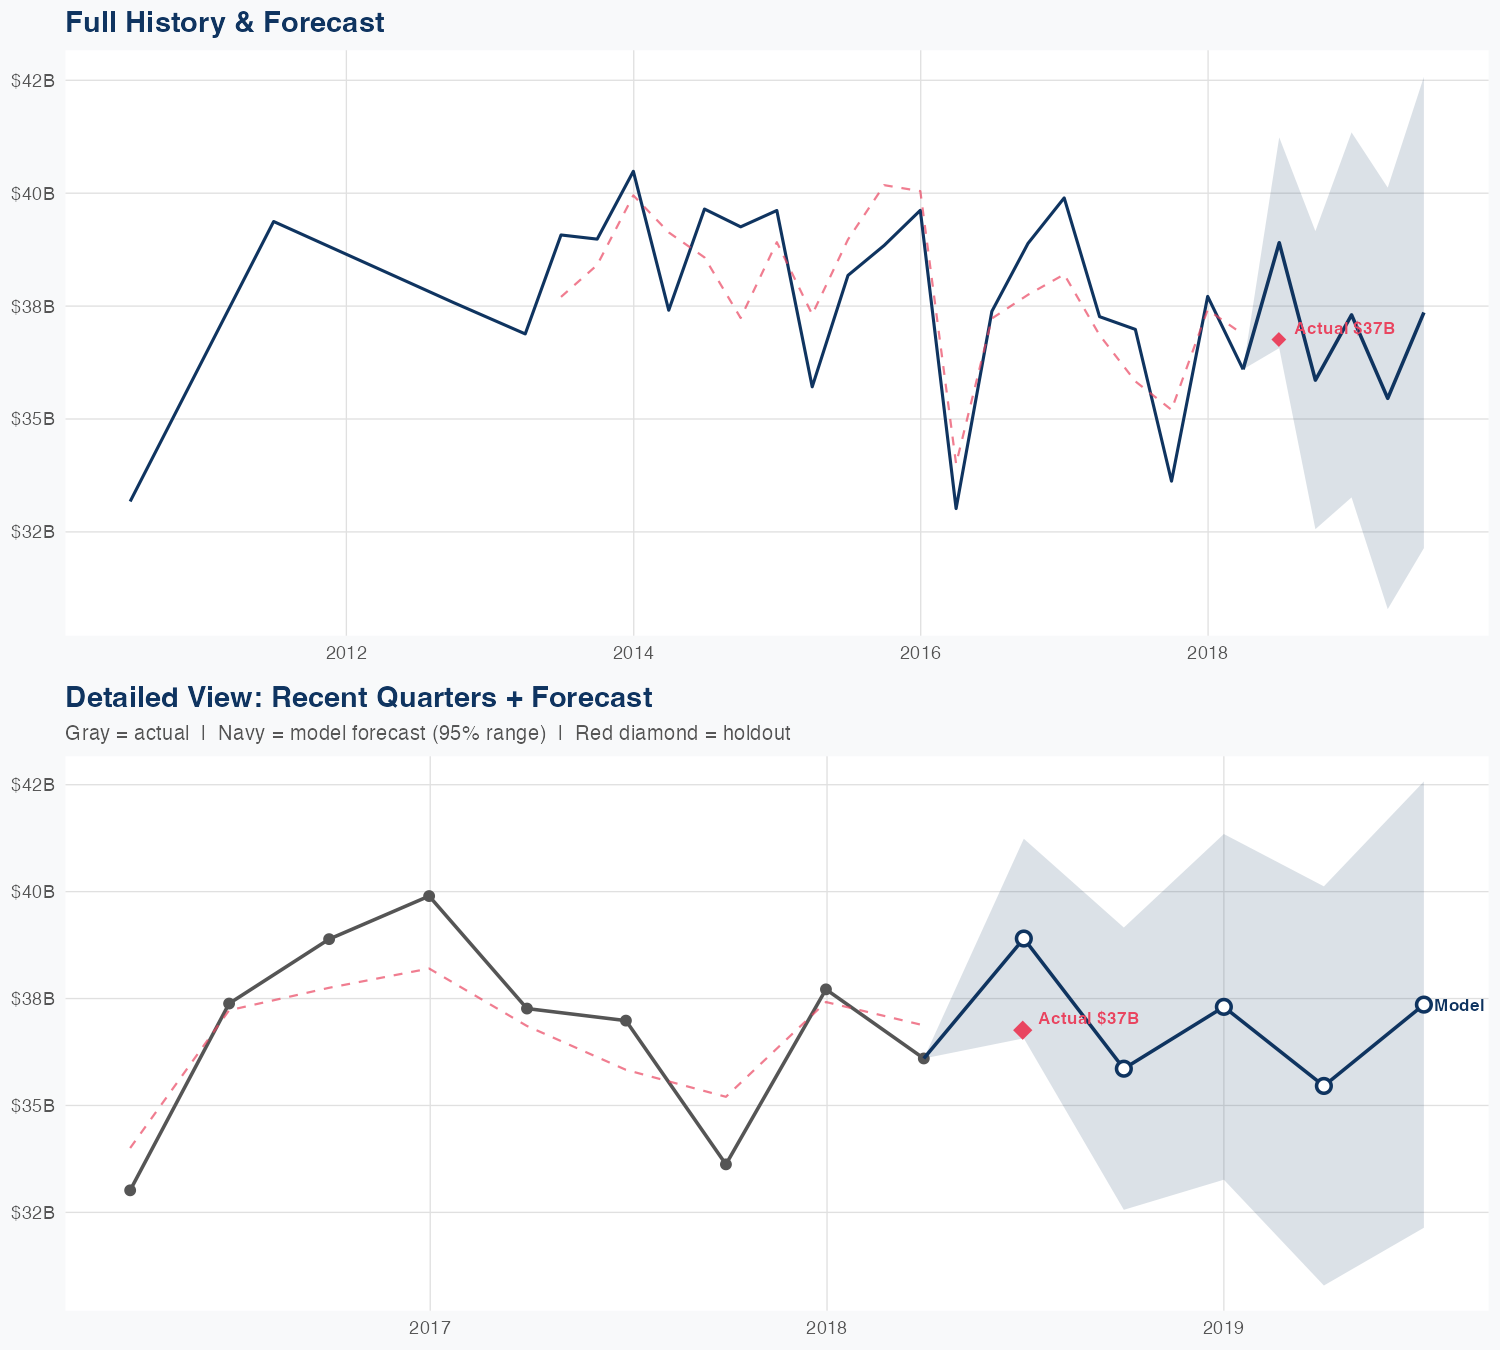
Quarterly Detail
| Quarter | Model Forecast | Actual | 95% Range | YoY Growth | Status |
|---|---|---|---|---|---|
| Q3 2018 | $39B | $37B | $37B – $41B | +5.2% | ✓ In range |
| Q4 2018 | $36B | $33B – $39B | +6.7% | ||
| Q1 2019 | $37B | $33B – $41B | -1.1% | ||
| Q2 2019 | $35B | $31B – $40B | -1.8% | ||
| Q3 2019 | $37B | $32B – $43B | +1.6% |
Seasonal Factors
| Fiscal Quarter | Seasonal Factor | vs Trend | Interpretation | Obs. |
|---|---|---|---|---|
| FQ1 (Sep–Nov) | 1.0149 | +1.5% | In line with trend | 5 |
| FQ2 (Dec–Feb) | 1.0134 | +1.3% | In line with trend | 5 |
| FQ3 (Mar–May) | 0.9709 | -2.9% | In line with trend | 5 |
| FQ4 (Jun–Aug) | 1.0278 | +2.8% | In line with trend | 6 |
How Spending Drives Revenue
Want this analysis for your portfolio?
I build custom revenue intelligence reports for investors and companies using SEC filing data, econometric modeling, and AI-powered insights.
Get in Touch