Home Depot, Inc. HD
Revenue Intelligence Report • 59 quarters of SEC filing data • Updated 2026-03-15
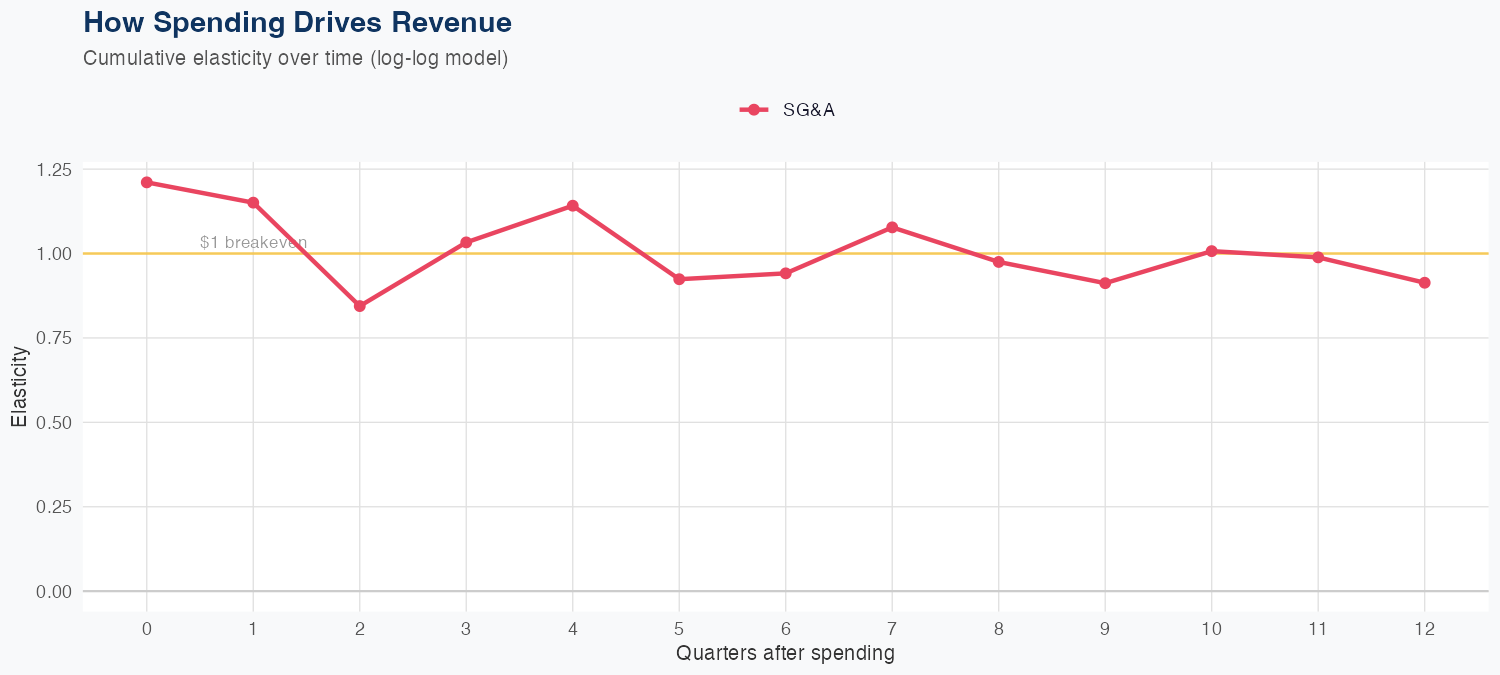
Our econometric model shows SG&A elasticity of 0.91x, meaning SG&A expands almost in line with revenue. That leaves little operating leverage: growth is more a function of topline gains and mix than cost discipline, so earnings momentum will rely on gross-margin improvements or price realization to lift margins. The holdout test overpredicted SG&A by about 6%, suggesting modest forecast bias and some reliability risk in the near term as efficiency and cost dynamics evolve. In this context, HD’s growth is vulnerable to wage/fulfillment costs and competitive pricing pressure; the key upside is sustained gross-margin expansion or efficiency gains that let SG&A grow slower than revenue.
Investment Thesis
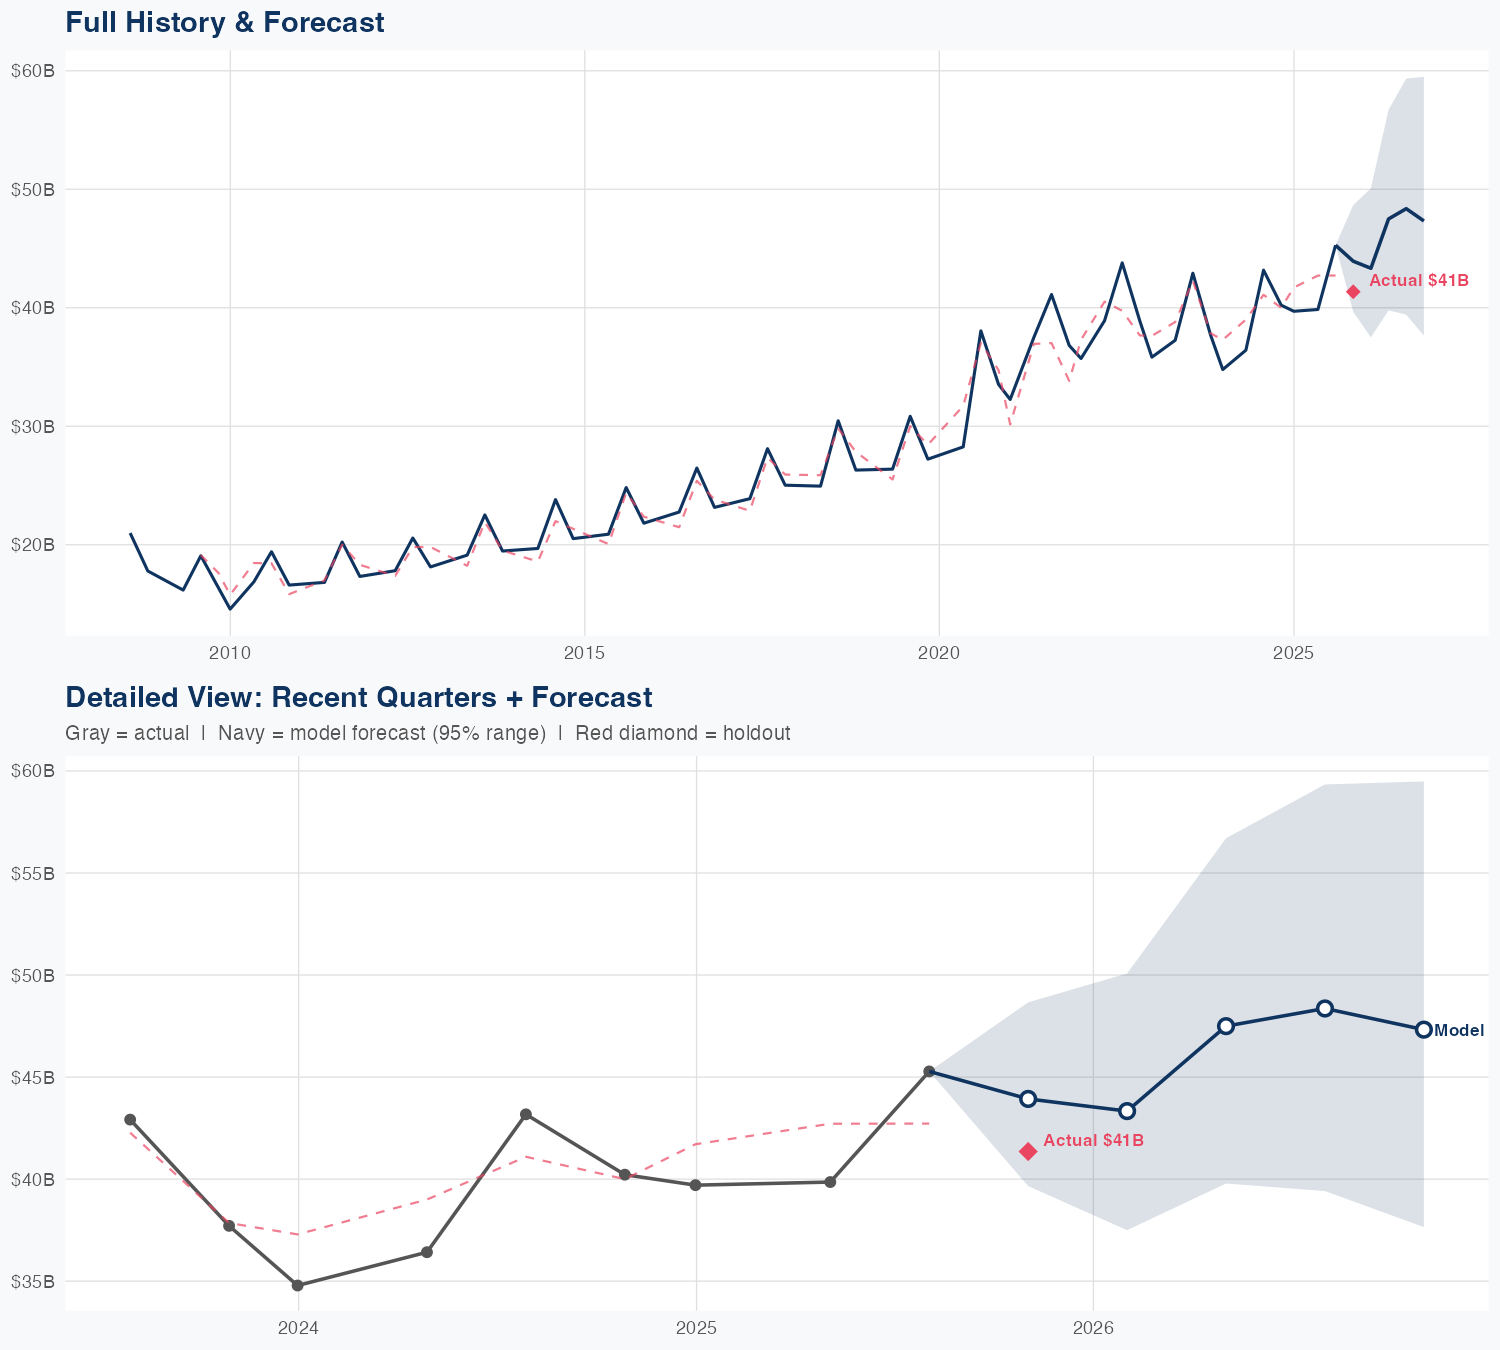
The econometric model achieves strong accuracy (4.5% MAPE), suggesting Home Depot, Inc.'s revenue trajectory is well-characterized by its spending patterns. Sales & marketing spend shows a 0.91x elasticity, suggesting effective go-to-market execution.
Revenue Forecast
Quarterly Detail
| Quarter | Model Forecast | Actual | 95% Range | YoY Growth | Status |
|---|---|---|---|---|---|
| Q4 2025 | $44B | $41B | $40B – $49B | +9.2% | ✓ In range |
| Q1 2026 | $43B | $37B – $50B | +9.1% | ||
| Q2 2026 | $47B | $40B – $57B | +19.2% | ||
| Q3 2026 | $48B | $39B – $59B | +6.8% | ||
| Q4 2026 | $47B | $38B – $59B | +14.4% |
Seasonal Factors
| Fiscal Quarter | Seasonal Factor | vs Trend | Interpretation | Obs. |
|---|---|---|---|---|
| FQ1 (Sep–Nov) | 0.9722 | -2.8% | In line with trend | 17 |
| FQ2 (Dec–Feb) | 0.9521 | -4.8% | -4.8% below trend | 6 |
| FQ3 (Mar–May) | 1.0148 | +1.5% | In line with trend | 16 |
| FQ4 (Jun–Aug) | 1.0278 | +2.8% | In line with trend | 17 |
How Spending Drives Revenue
Want this analysis for your portfolio?
I build custom revenue intelligence reports for investors and companies using SEC filing data, econometric modeling, and AI-powered insights.
Get in Touch