The Hartford Insurance Group, Inc. HIG
Revenue Intelligence Report • 26 quarters of SEC filing data • Updated 2026-03-15
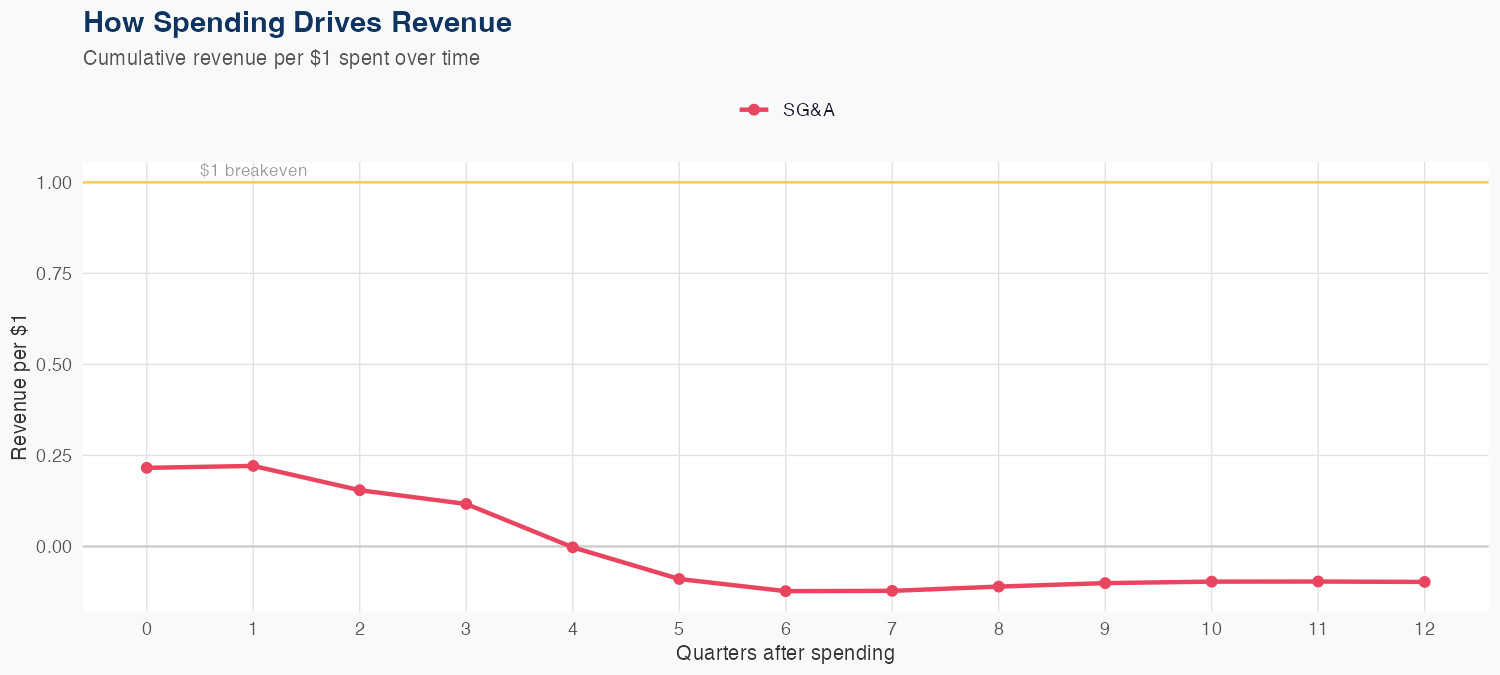
Revenue is driven by SG&A investments, with a log-log elasticity of 1.25, meaning a 1% increase in SG&A spending is associated with a 1.25% rise in revenue, indicating marketing and sales spend is a key growth lever. The model shows strong predictive accuracy, with a 2.3% MAPE and a holdout test predicting 7.3B revenue to within 0.1% of actual, reinforcing the reliability of the SG&A–revenue link. The FY outlook calls for about $31B in revenue, up 8.4% year over year, signaling solid top-line growth ahead. ROI on SG&A appears favorable given elasticity above 1, implying incremental SG&A investments can yield outsized revenue gains, though profitability will hinge on underwriting results and expense efficiency; the model supports using this framework for scenario planning and investment decisions.
Investment Thesis
Our ARDL model tracks The Hartford Insurance Group, Inc.'s revenue with exceptional precision (2.3% MAPE), indicating highly predictable cash flows. Sales & marketing spend shows a 1.25x elasticity, suggesting effective go-to-market execution.
Revenue Forecast
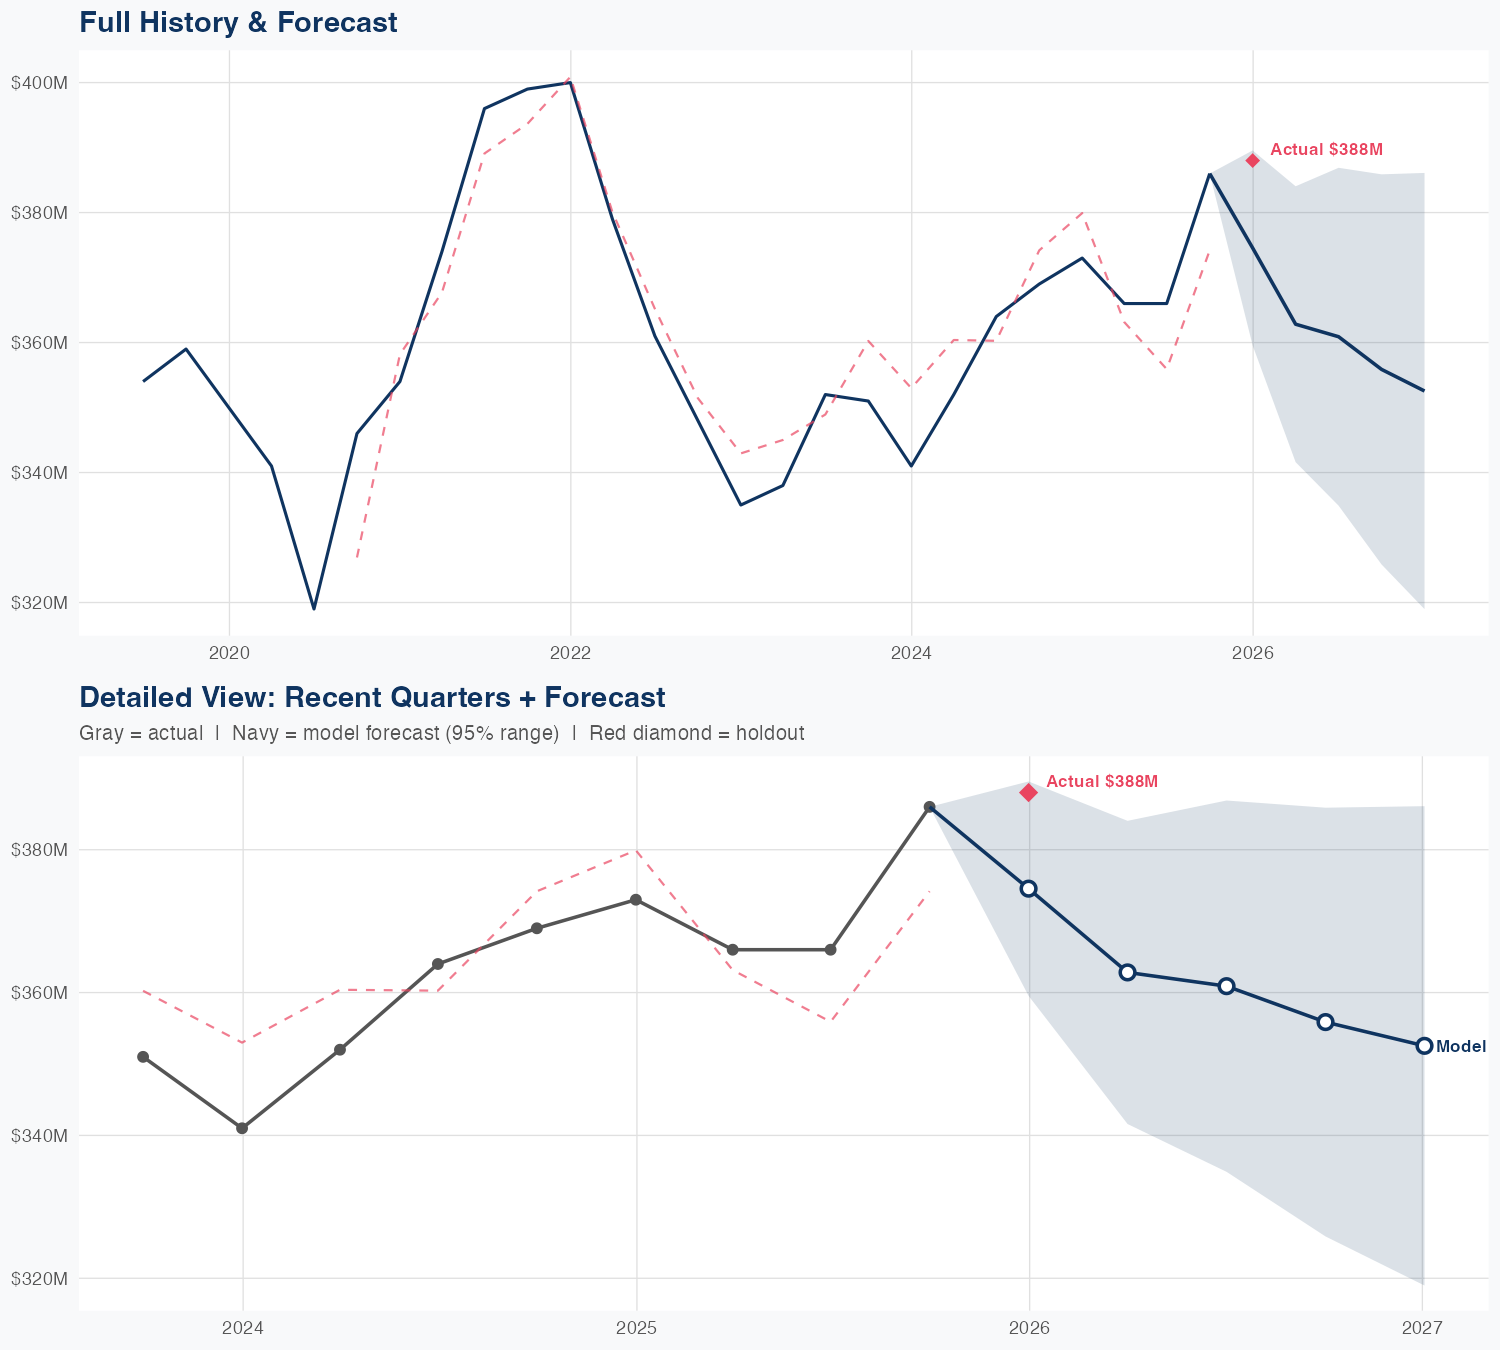
Quarterly Detail
| Quarter | Model Forecast | Actual | 95% Range | YoY Growth | Status |
|---|---|---|---|---|---|
| Q4 2025 | $7.3B | $7.3B | $6.9B – $7.8B | +6.8% | ✓ In range |
| Q2 2026 | $7.5B | $6.8B – $8.2B | +9.7% | ||
| Q3 2026 | $7.6B | $6.8B – $8.5B | +8.9% | ||
| Q4 2026 | $7.8B | $6.8B – $8.8B | +7.3% | ||
| Q1 2027 | $7.9B | $6.8B – $9.1B | +7.9% |
Seasonal Factors
| Fiscal Quarter | Seasonal Factor | vs Trend | Interpretation | Obs. |
|---|---|---|---|---|
| FQ1 (Sep–Nov) | 1.0164 | +1.6% | In line with trend | 7 |
| FQ2 (Dec–Feb) | 1.0242 | +2.4% | In line with trend | 6 |
| FQ3 (Mar–May) | 0.9785 | -2.1% | In line with trend | 6 |
| FQ4 (Jun–Aug) | 1.0112 | +1.1% | In line with trend | 6 |
How Spending Drives Revenue
Want this analysis for your portfolio?
I build custom revenue intelligence reports for investors and companies using SEC filing data, econometric modeling, and AI-powered insights.
Get in Touch