International Business Machines Corporation IBM
Revenue Intelligence Report • 70 quarters of SEC filing data • Updated 2026-03-15
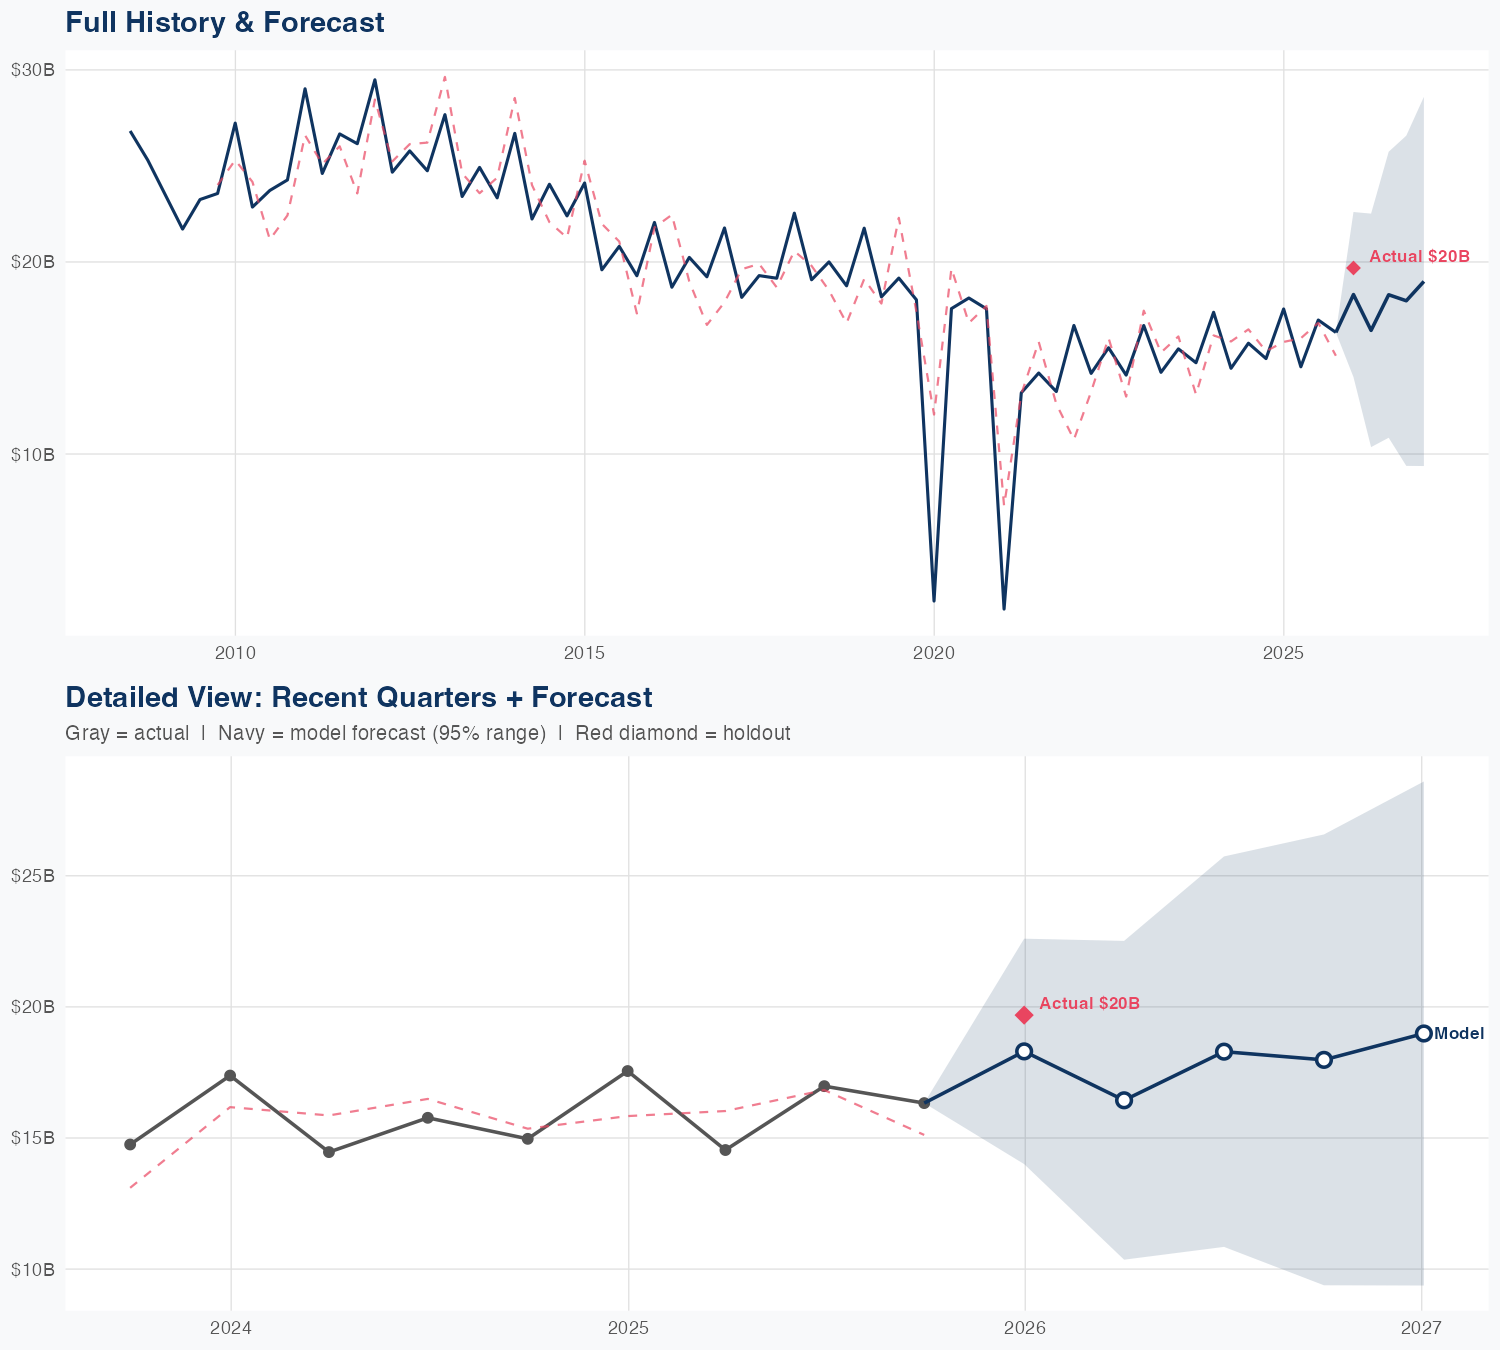
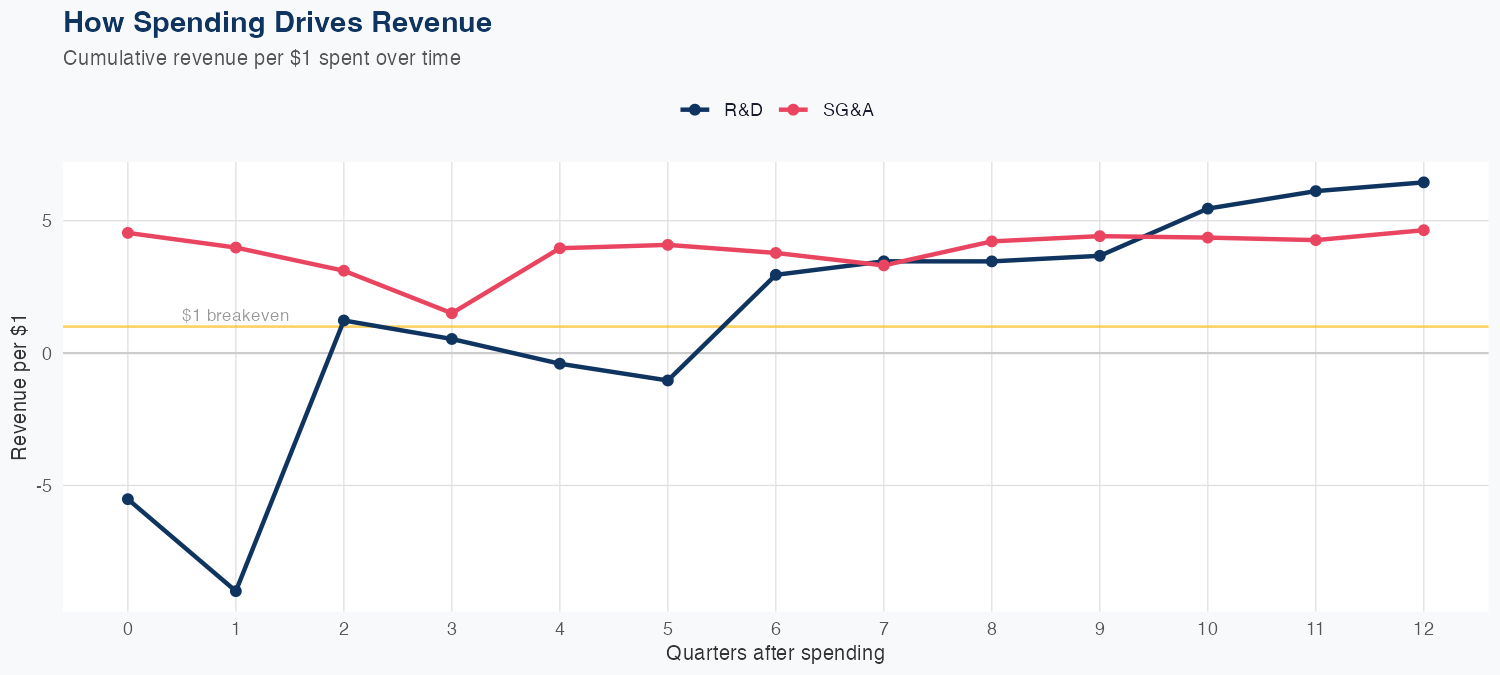
Revenue is driven by strong returns on operating spend, with the model indicating $6.45 of long-run revenue per $1 of R&D and $4.64 per $1 of SG&A. The linear model trained on 70 quarters shows moderate predictive accuracy (MAPE 17.5%), with a holdout test illustrating forecast risk: predicted $18B vs actual $20B, a 7% miss. The FY outlook calls for about $72B in revenue, up 6.2% year over year, reflecting the constructive growth path supported by the ROI of current spending. Investors should weigh the compelling ROI signals from R&D and SG&A against model uncertainty and external macro factors, as the forecast implies steady expansion but execution and demand conditions will matter.
Investment Thesis
At 17.5% MAPE, the model captures International Business Machines Corporation's broad revenue trajectory, though quarterly variability suggests sensitivity to external factors. Every $1 of R&D investment is associated with $6.45 of revenue, indicating efficient capital deployment in innovation. Each $1 of SG&A spending generates $4.64 in revenue, reflecting strong commercial efficiency.
Revenue Forecast
Quarterly Detail
| Quarter | Model Forecast | Actual | 95% Range | YoY Growth | Status |
|---|---|---|---|---|---|
| Q4 2025 | $18B | $20B | $14B – $23B | +4.3% | ✓ In range |
| Q2 2026 | $16B | $10B – $23B | +13.0% | ||
| Q3 2026 | $18B | $11B – $26B | +7.7% | ||
| Q4 2026 | $18B | $9.4B – $27B | +10.1% | ||
| Q1 2027 | $19B | $9.4B – $29B | -3.6% |
Seasonal Factors
| Fiscal Quarter | Seasonal Factor | vs Trend | Interpretation | Obs. |
|---|---|---|---|---|
| FQ1 (Sep–Nov) | 1.0534 | +5.3% | +5.3% above trend | 17 |
| FQ2 (Dec–Feb) | 1.0361 | +3.6% | +3.6% above trend | 17 |
| FQ3 (Mar–May) | 0.9456 | -5.4% | -5.4% below trend | 16 |
| FQ4 (Jun–Aug) | 1.0088 | +0.9% | In line with trend | 16 |
How Spending Drives Revenue
Want this analysis for your portfolio?
I build custom revenue intelligence reports for investors and companies using SEC filing data, econometric modeling, and AI-powered insights.
Get in Touch