Lululemon Athletica Inc. LULU
Revenue Intelligence Report • 65 quarters of SEC filing data • Updated 2026-03-15
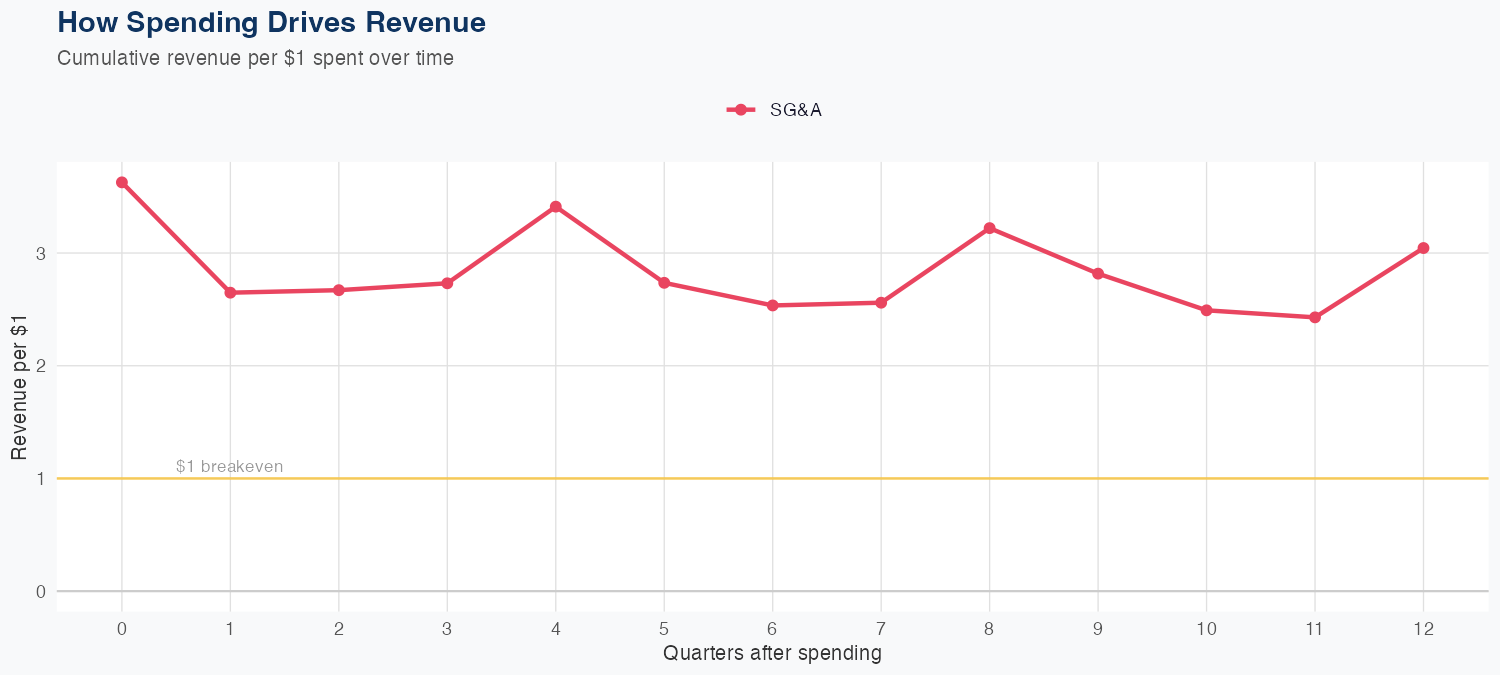
Revenue growth is driven by highly efficient SG&A spending, with every $1 of SG&A generating about $3.04 of long-run revenue, indicating strong ROI on selling and marketing activities. The latest quarterly revenue is 2,566 million, and the FY forecast is about 12,000 million, representing roughly 4.6% year-over-year growth. Model performance shows a 3.4% MAPE and a holdout error of -4.9% (predicted 2.7B vs actual 2.6B), suggesting reasonable forecast reliability under current driver assumptions. R&D data is not available; with SG&A ROI remaining intact, the company appears positioned for continued revenue expansion ahead.
Investment Thesis
The econometric model achieves strong accuracy (3.4% MAPE), suggesting Lululemon Athletica Inc.'s revenue trajectory is well-characterized by its spending patterns. Each $1 of SG&A spending generates $3.04 in revenue, reflecting strong commercial efficiency.
Revenue Forecast
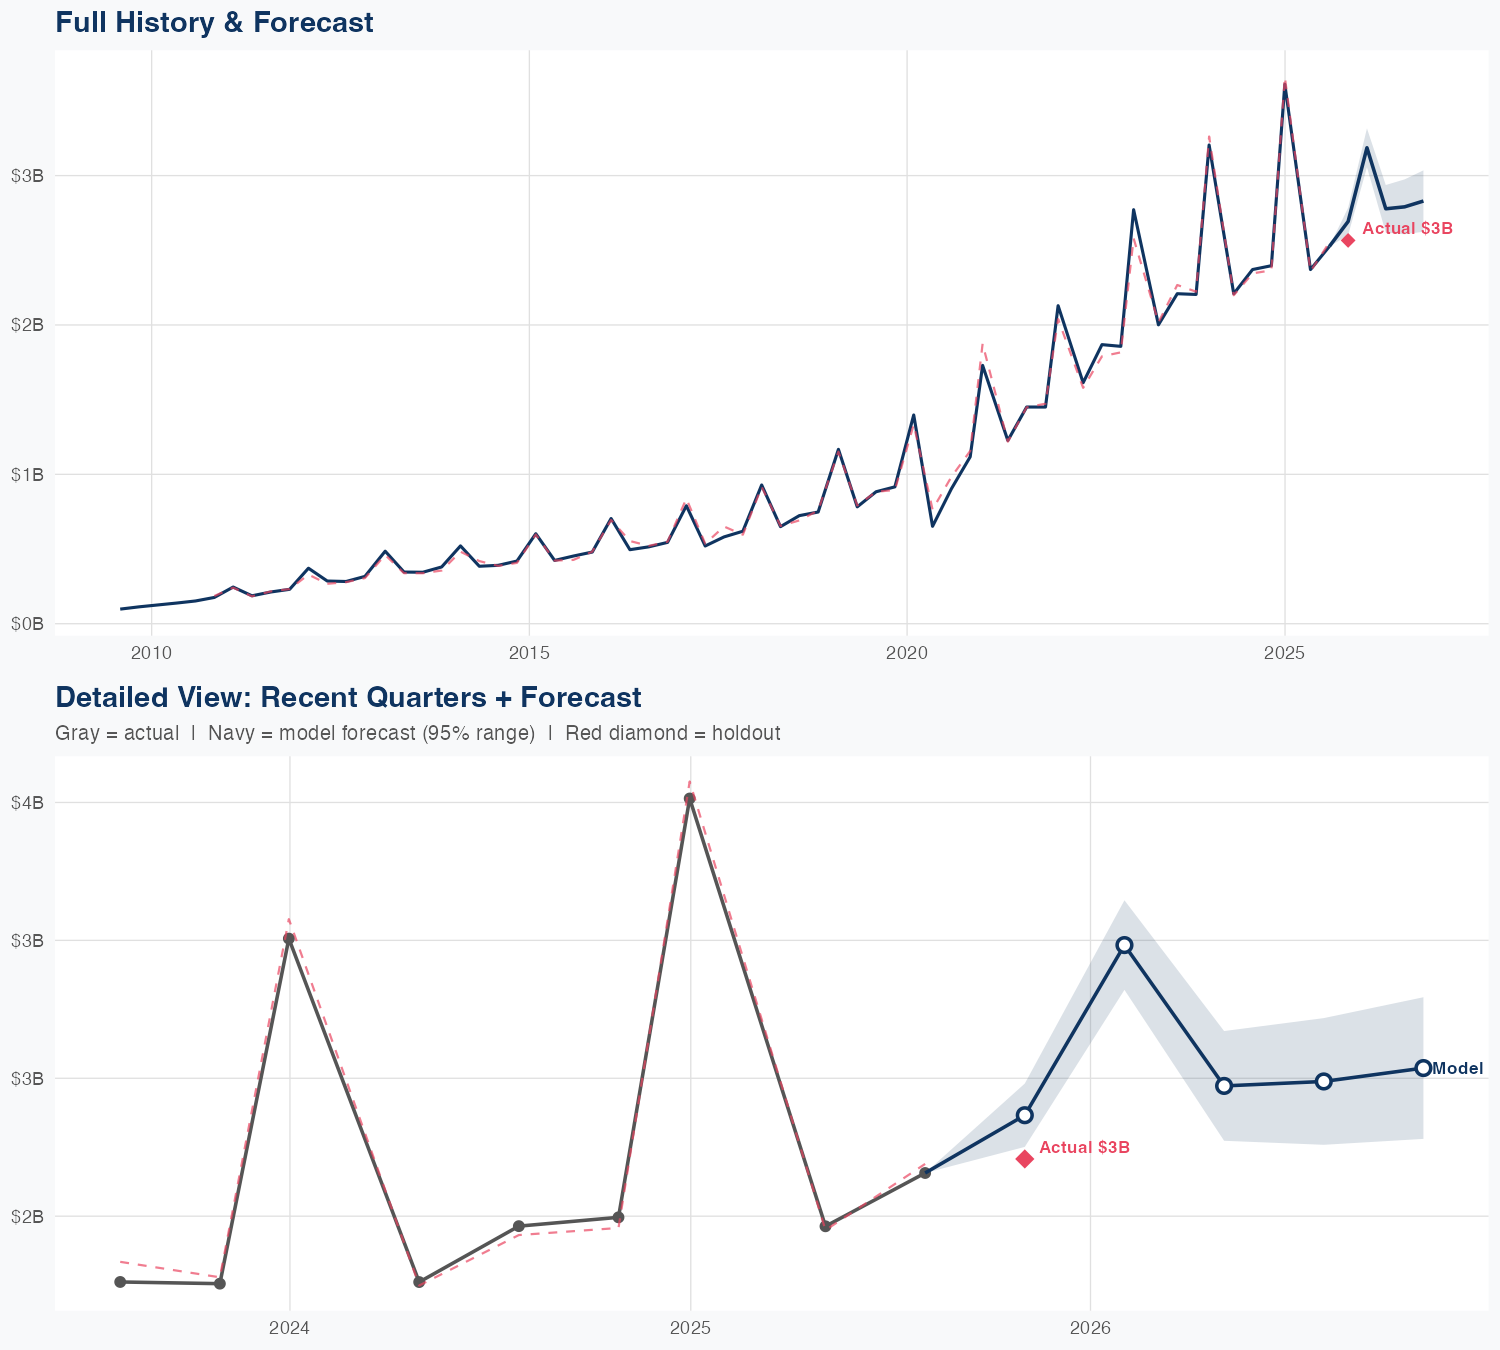
Quarterly Detail
| Quarter | Model Forecast | Actual | 95% Range | YoY Growth | Status |
|---|---|---|---|---|---|
| Q4 2025 | $2.7B | $2.6B | $2.6B – $2.8B | +12.4% | ✗ Outside range |
| Q1 2026 | $3.2B | $3.1B – $3.3B | -11.8% | ||
| Q2 2026 | $2.8B | $2.6B – $2.9B | +17.2% | ||
| Q3 2026 | $2.8B | $2.6B – $3.0B | +10.5% | ||
| Q4 2026 | $2.8B | $2.6B – $3.0B | +10.3% |
Seasonal Factors
| Fiscal Quarter | Seasonal Factor | vs Trend | Interpretation | Obs. |
|---|---|---|---|---|
| FQ1 (Sep–Nov) | 0.9946 | -0.5% | In line with trend | 16 |
| FQ2 (Dec–Feb) | 1.0146 | +1.5% | In line with trend | 15 |
| FQ3 (Mar–May) | 1.0023 | +0.2% | In line with trend | 15 |
| FQ4 (Jun–Aug) | 1.0012 | +0.1% | In line with trend | 15 |
How Spending Drives Revenue
Want this analysis for your portfolio?
I build custom revenue intelligence reports for investors and companies using SEC filing data, econometric modeling, and AI-powered insights.
Get in Touch