Las Vegas Sands Corp. LVS
Revenue Intelligence Report • 20 quarters of SEC filing data • Updated 2026-03-15
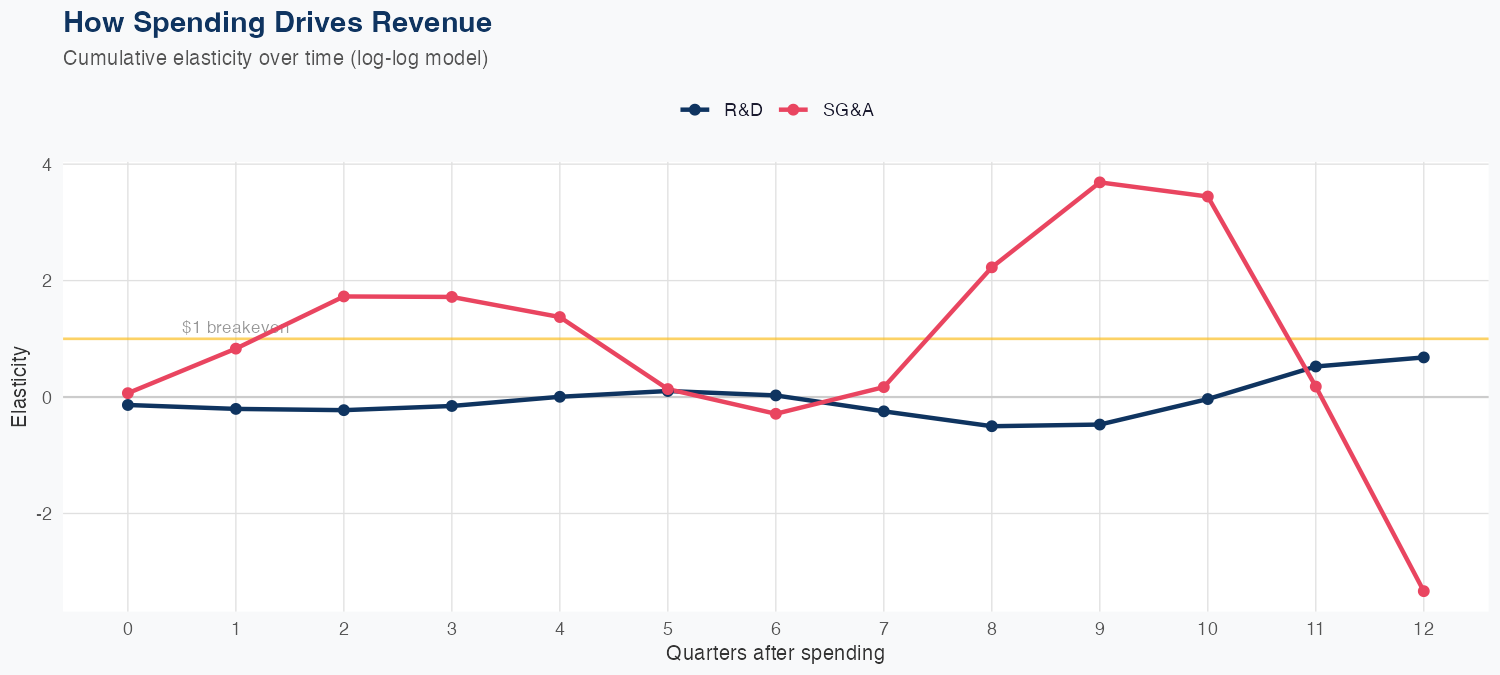
Revenue responds positively to R&D investment, with every 1% increase in R&D yielding a 0.68% rise in revenue, while SG&A increases depress revenue by about 3.33% per 1% SG&A. The model is a log-log specification and shows an in-sample MAPE of 0.0%, but out-of-sample holdout results underperformed, predicting $3.3B against $3.6B actual (8.7% error). For the full year, revenue is forecast to be around $12B, down 8.1% year over year, signaling headwinds despite the positive R&D elasticity. In terms of ROI, R&D spending offers a positive but modest uplift, whereas SG&A expansion appears to erode revenue; the outlook suggests a tighter cost posture on SG&A and disciplined R&D deployment will be essential to stabilize revenue in the coming year.
Investment Thesis
Our ARDL model tracks Las Vegas Sands Corp.'s revenue with exceptional precision (0.0% MAPE), indicating highly predictable cash flows. R&D investment shows a 0.68x multiplier — each 1% increase in R&D spend is associated with a 0.68% revenue increase, signaling strong innovation-to-revenue conversion.
Revenue Forecast
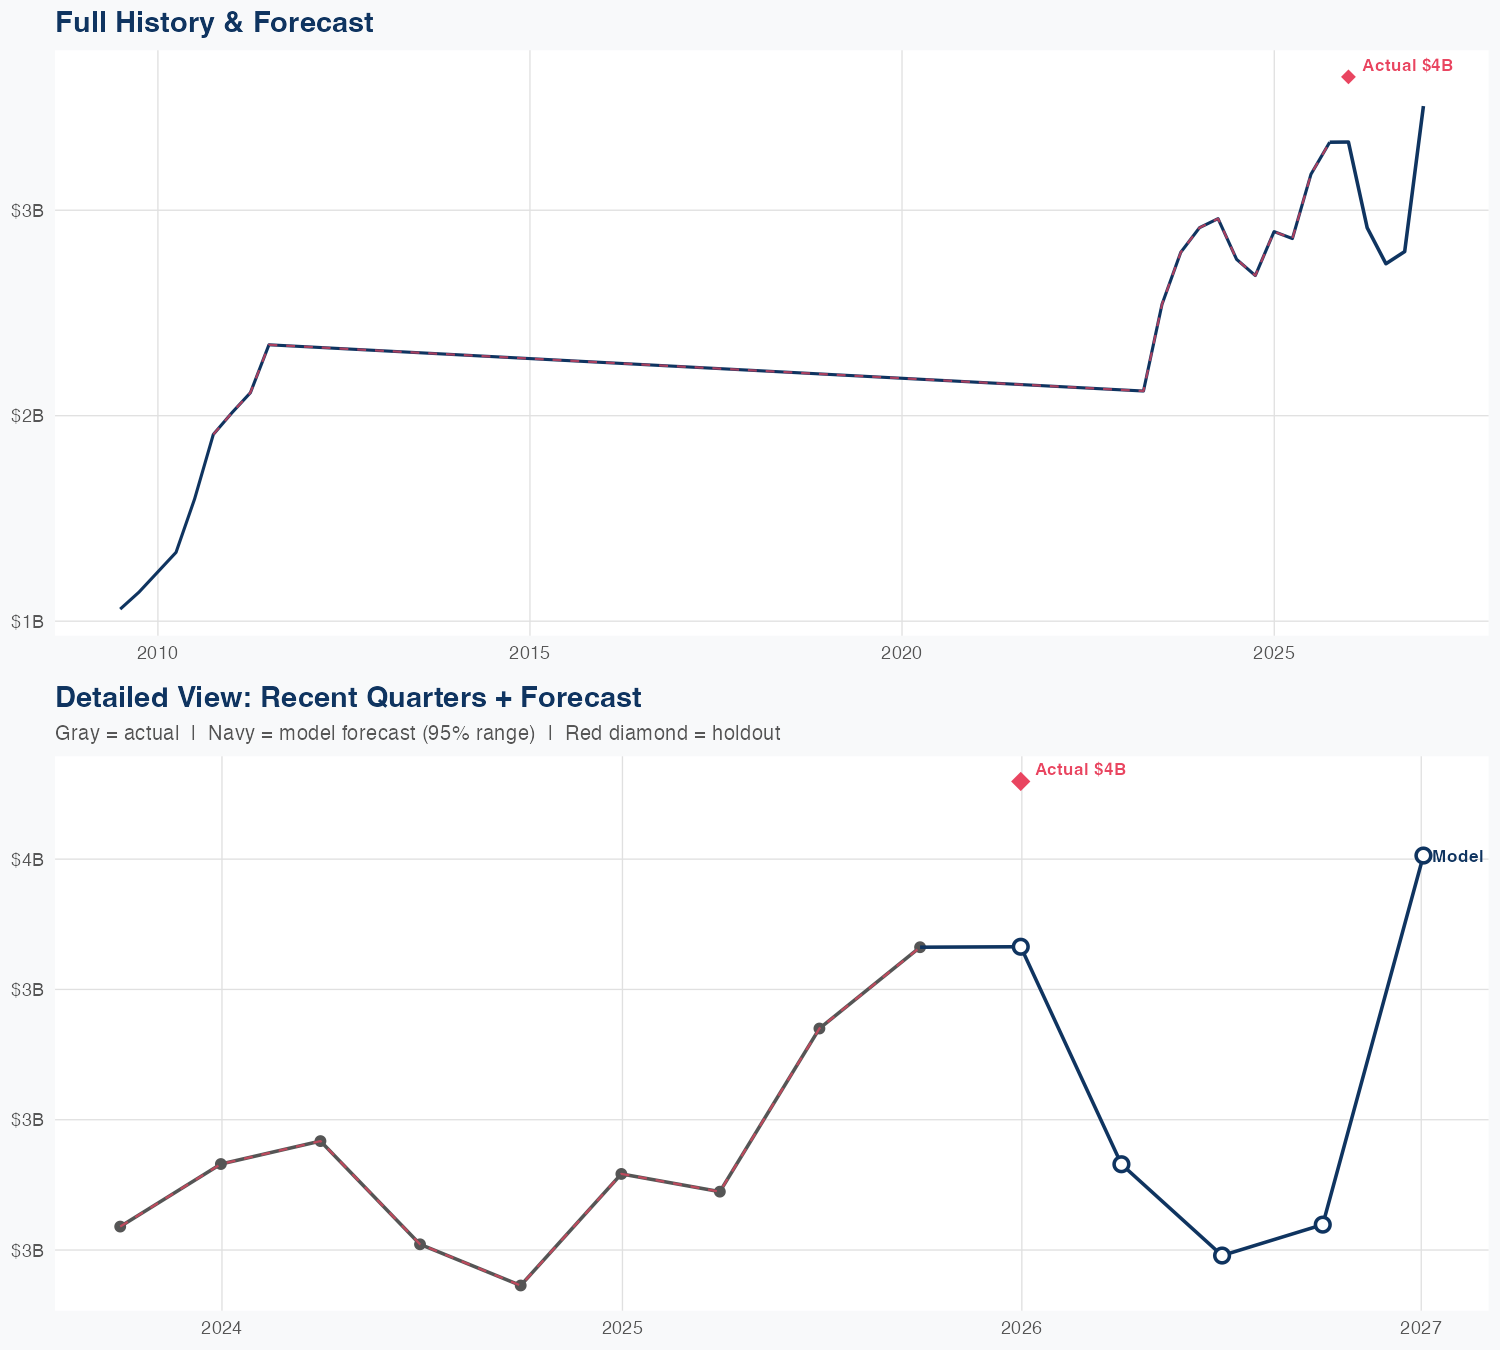
Quarterly Detail
| Quarter | Model Forecast | Actual | 95% Range | YoY Growth | Status |
|---|---|---|---|---|---|
| Q4 2025 | $3.3B | $3.6B | $3.3B – $3.3B | +15.1% | ✗ Outside range |
| Q2 2026 | $2.9B | $2.9B – $2.9B | +1.8% | ||
| Q3 2026 | $2.7B | $2.7B – $2.7B | -13.7% | ||
| Q4 2026 | $2.8B | $2.8B – $2.8B | -16.0% | ||
| Q1 2027 | $3.5B | $3.5B – $3.5B | -3.9% |
Seasonal Factors
| Fiscal Quarter | Seasonal Factor | vs Trend | Interpretation | Obs. |
|---|---|---|---|---|
| FQ1 (Sep–Nov) | 1.0 | +0.0% | In line with trend | 4 |
| FQ2 (Dec–Feb) | 1.0 | +0.0% | In line with trend | 4 |
| FQ3 (Mar–May) | 1.0 | -0.0% | In line with trend | 4 |
| FQ4 (Jun–Aug) | 1.0 | +0.0% | In line with trend | 4 |
How Spending Drives Revenue
Want this analysis for your portfolio?
I build custom revenue intelligence reports for investors and companies using SEC filing data, econometric modeling, and AI-powered insights.
Get in Touch