Mondelez International, Inc. MDLZ
Revenue Intelligence Report • 70 quarters of SEC filing data • Updated 2026-03-15
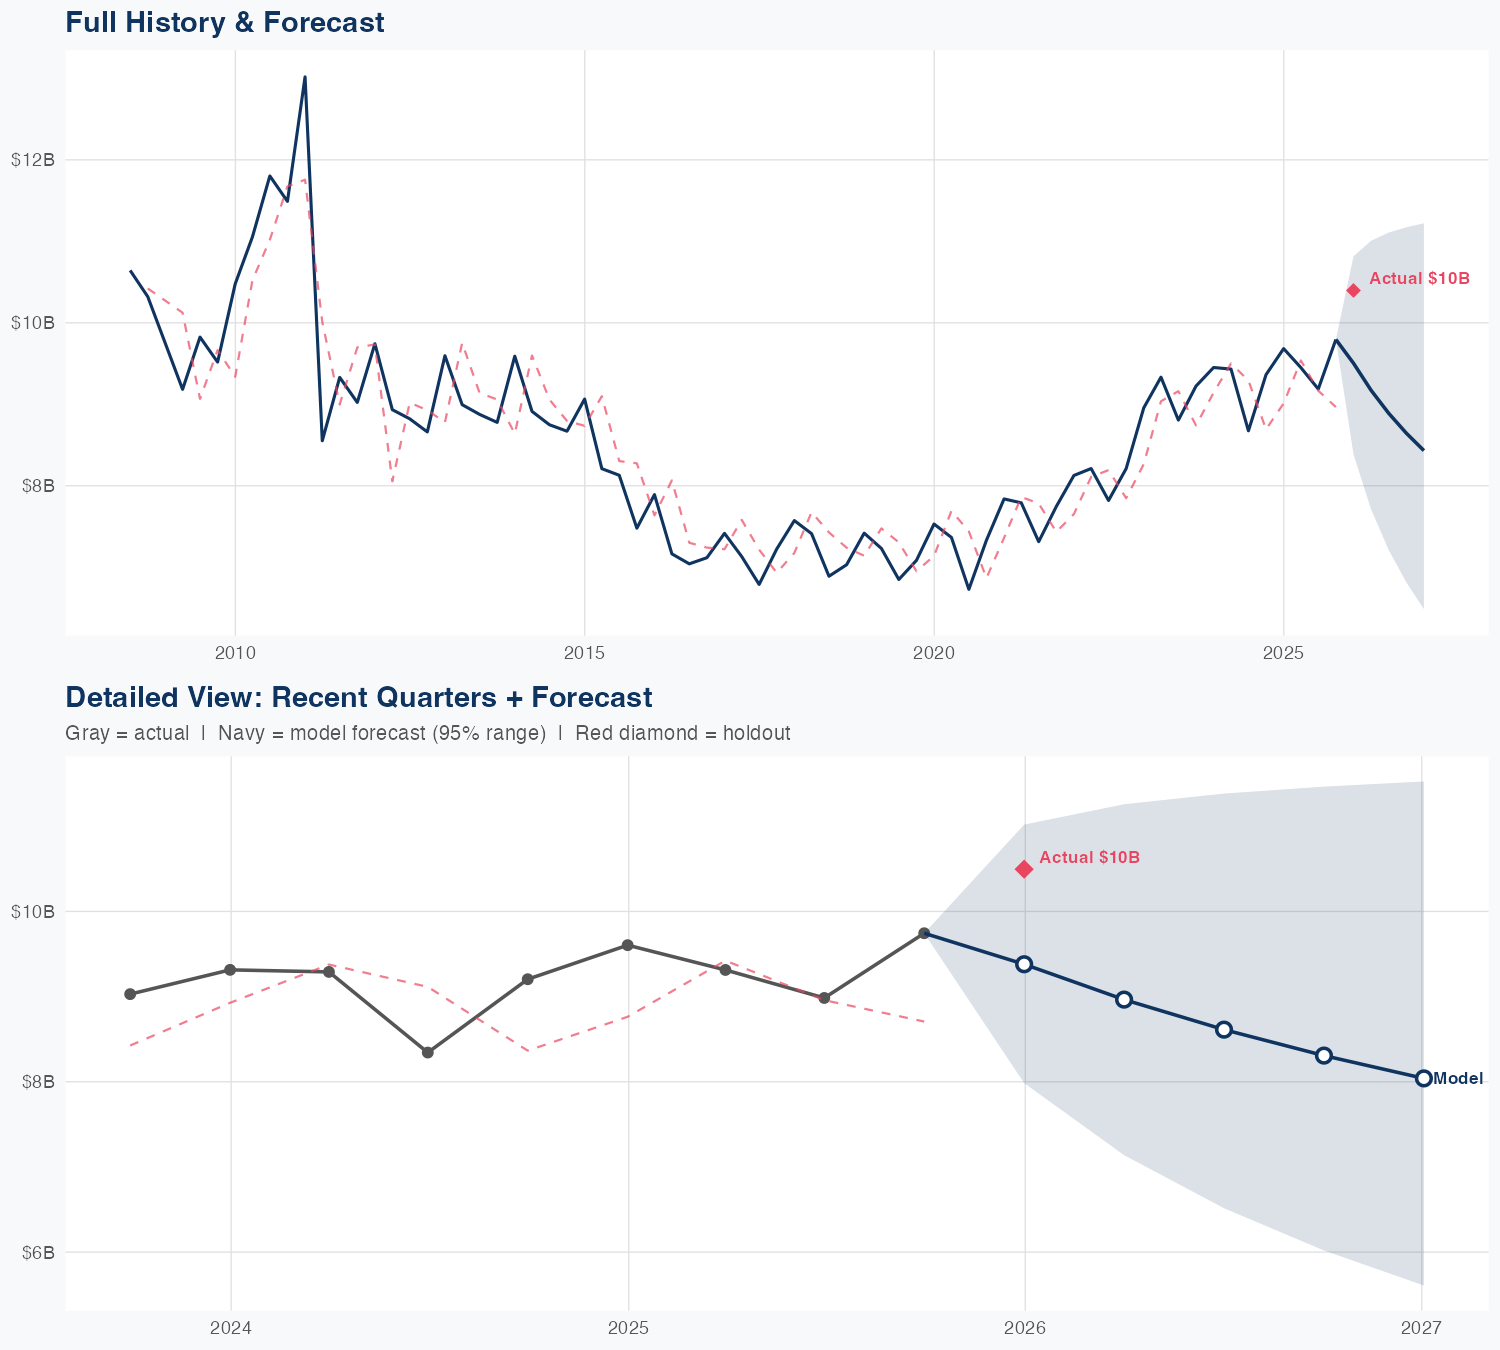
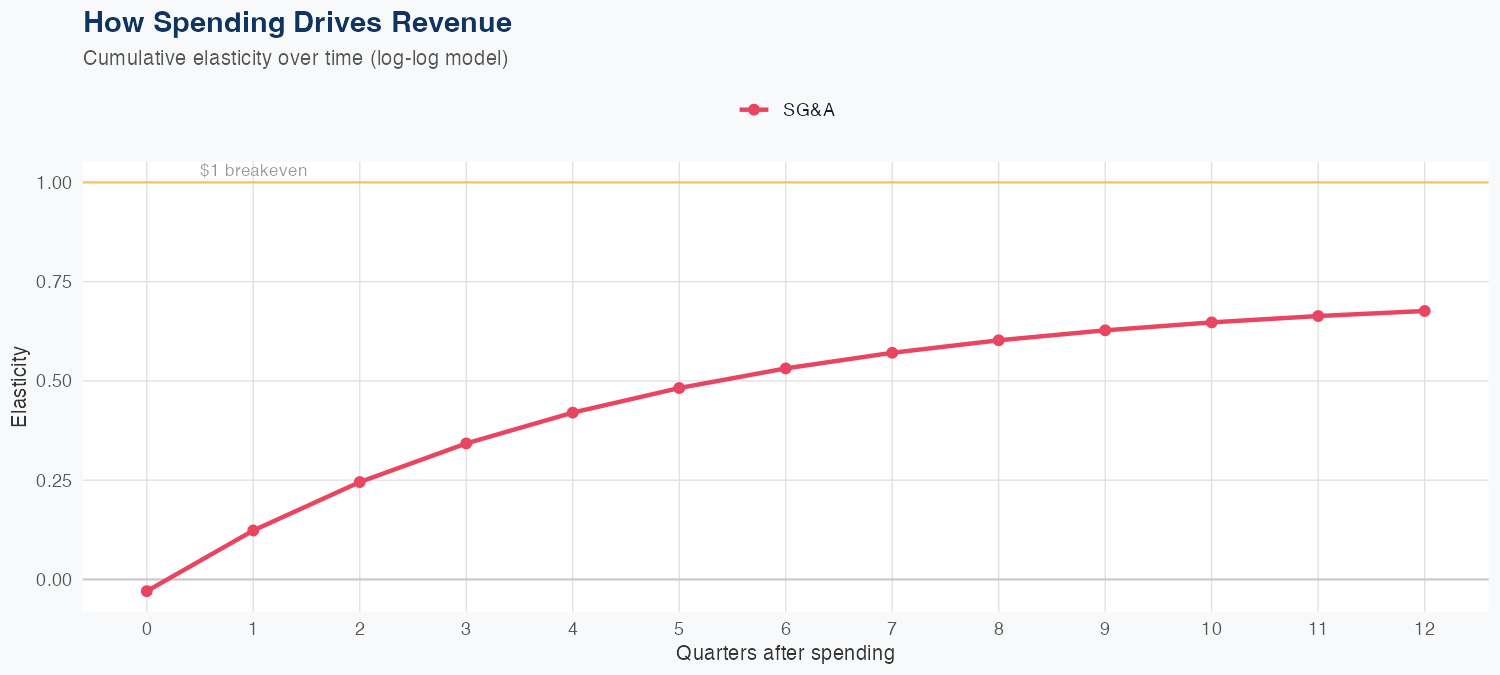
Revenue is primarily driven by SG&A investments, where a 1% increase in SG&A is associated with a 0.68% rise in revenue, signaling a modest but positive ROI on selling and marketing spend. The forecasting model uses a log-log specification and yields a 7.0% MAPE, with a holdout error of 10.6% (predicted $9.4B vs actual $10B), indicating reasonable accuracy given 70 quarters of history. R&D data are not available, so the revenue attribution relies exclusively on SG&A dynamics. The FY revenue forecast is about $34B, down 12% year over year, implying near-term headwinds despite the survey showing a steady quarterly run rate around $10B.
Investment Thesis
The econometric model achieves strong accuracy (7.0% MAPE), suggesting Mondelez International, Inc.'s revenue trajectory is well-characterized by its spending patterns. Sales & marketing spend shows a 0.68x elasticity, suggesting effective go-to-market execution.
Revenue Forecast
Quarterly Detail
| Quarter | Model Forecast | Actual | 95% Range | YoY Growth | Status |
|---|---|---|---|---|---|
| Q4 2025 | $9.4B | $10B | $8.0B – $11B | -2.3% | ✓ In range |
| Q2 2026 | $9.0B | $7.1B – $11B | -3.7% | ||
| Q3 2026 | $8.6B | $6.5B – $11B | -4.1% | ||
| Q4 2026 | $8.3B | $6.0B – $11B | -14.7% | ||
| Q1 2027 | $8.0B | $5.6B – $12B | -23.4% |
Seasonal Factors
| Fiscal Quarter | Seasonal Factor | vs Trend | Interpretation | Obs. |
|---|---|---|---|---|
| FQ1 (Sep–Nov) | 0.988 | -1.2% | In line with trend | 18 |
| FQ2 (Dec–Feb) | 1.0837 | +8.4% | +8.4% above trend | 17 |
| FQ3 (Mar–May) | 0.9535 | -4.6% | -4.6% below trend | 17 |
| FQ4 (Jun–Aug) | 0.9512 | -4.9% | -4.9% below trend | 17 |
How Spending Drives Revenue
Want this analysis for your portfolio?
I build custom revenue intelligence reports for investors and companies using SEC filing data, econometric modeling, and AI-powered insights.
Get in Touch