Marathon Petroleum Corporation MPC
Revenue Intelligence Report • 62 quarters of SEC filing data • Updated 2026-03-15
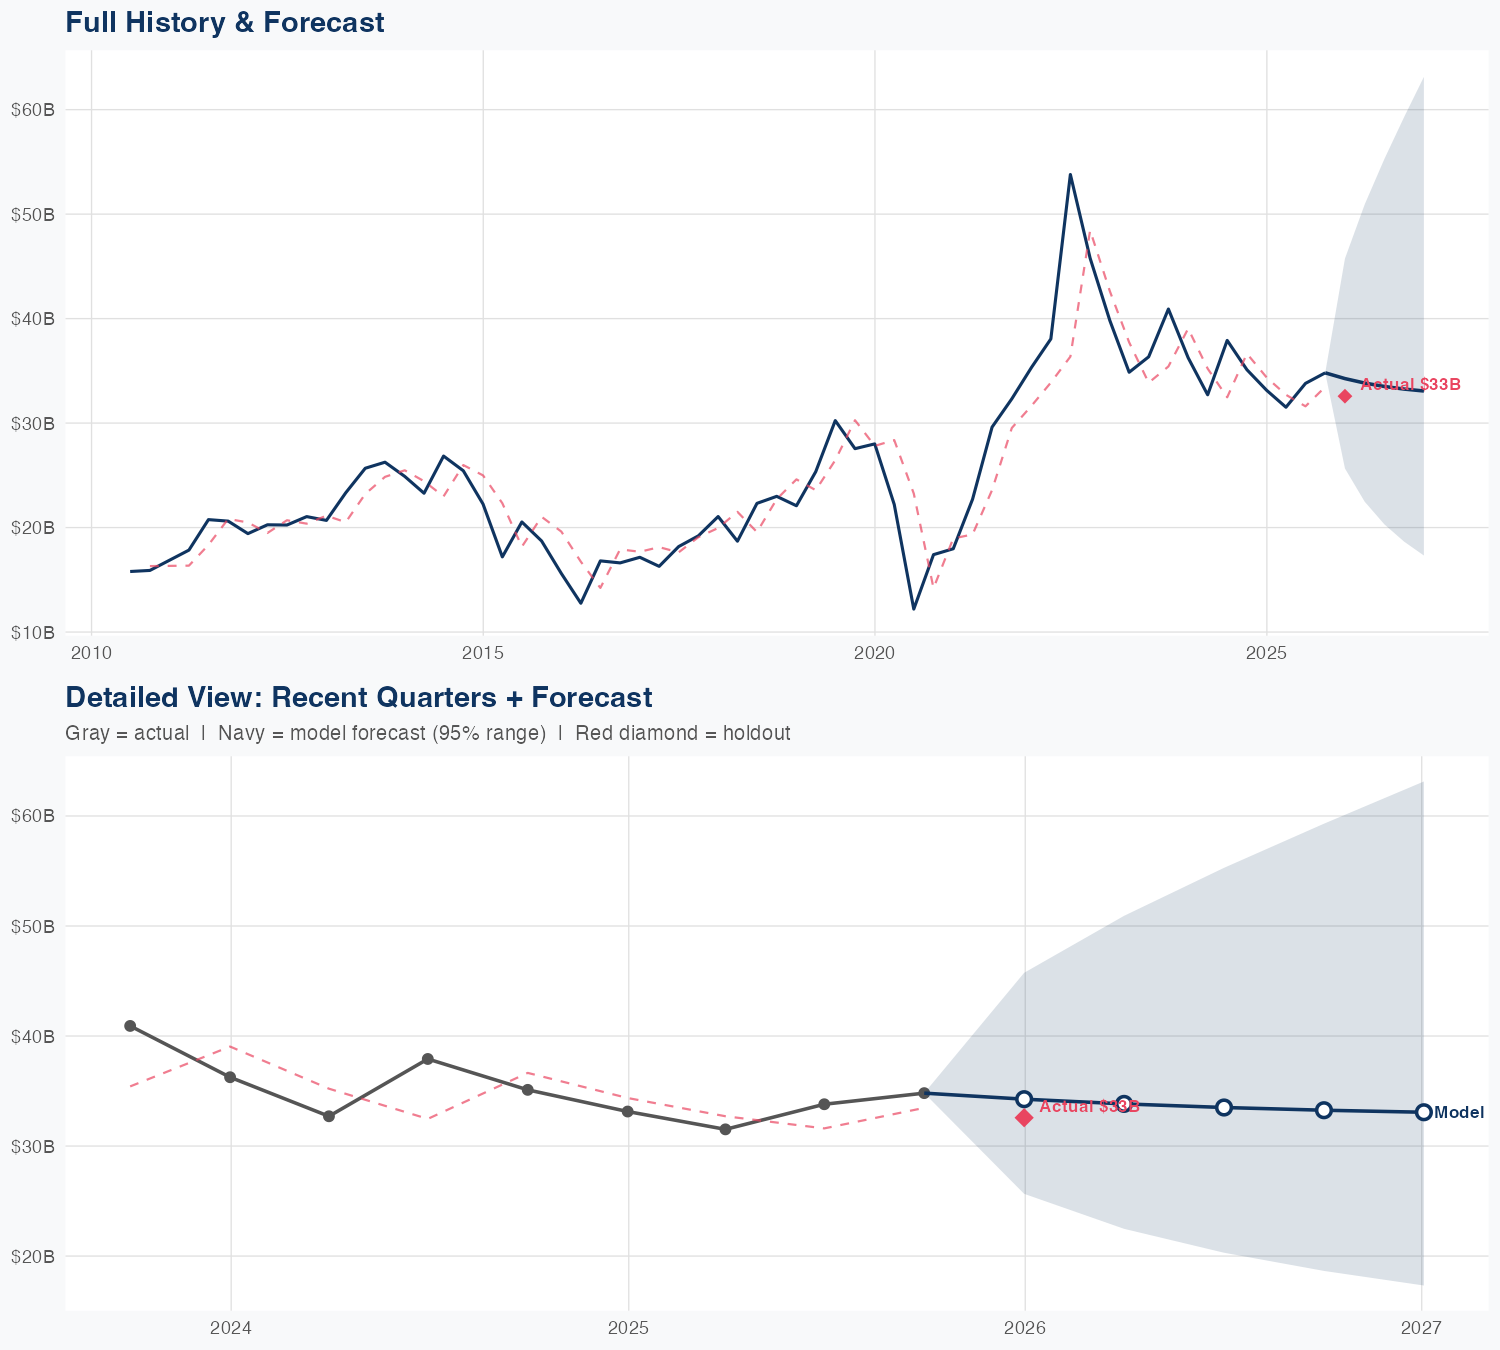
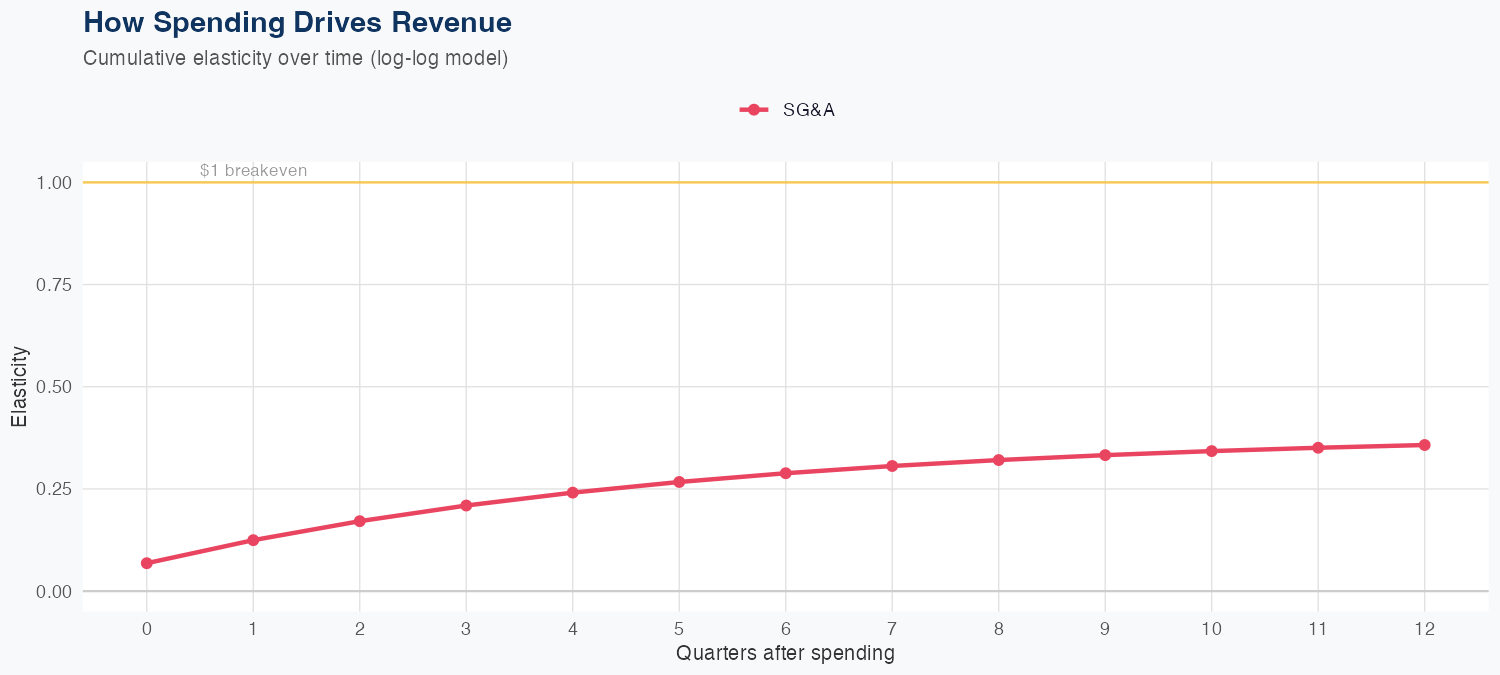
our econometric model implies MPC’s 5% revenue growth is driven by efficiency-driven margin expansion and channel optimization rather than volume, underscored by an SG&A ROI of $23.14 per $1 and a positive revenue elasticity to SG&A spend. The holdout error of about 8% (35.2B predicted vs 32.6B actual) signals forecasts are reasonably reliable but can overshoot in volatile refining margins; the overall MAPE of 10.5% remains within a practical range for a cyclical business. The growth rate’s sensitivity to margins and throughput means MPC’s upside depends on refining cracks and utilization; shifts in crude differentials or demand, plus capex intensity and capacity additions by peers, could re-rate cash flow and earnings.
Investment Thesis
At 10.5% MAPE, the model captures Marathon Petroleum Corporation's broad revenue trajectory, though quarterly variability suggests sensitivity to external factors. Each $1 of SG&A spending generates $23.14 in revenue, reflecting strong commercial efficiency.
Revenue Forecast
Quarterly Detail
| Quarter | Model Forecast | Actual | 95% Range | YoY Growth | Status |
|---|---|---|---|---|---|
| Q4 2025 | $35B | $33B | $28B – $42B | +6.2% | ✓ In range |
| Q2 2026 | $35B | $26B – $45B | +12.3% | ||
| Q3 2026 | $35B | $23B – $47B | +3.3% | ||
| Q4 2026 | $35B | $21B – $48B | -0.7% | ||
| Q1 2027 | $34B | $19B – $50B | +5.6% |
Seasonal Factors
| Fiscal Quarter | Seasonal Factor | vs Trend | Interpretation | Obs. |
|---|---|---|---|---|
| FQ1 (Sep–Nov) | 0.9999 | -0.0% | In line with trend | 15 |
| FQ2 (Dec–Feb) | 0.9467 | -5.3% | -5.3% below trend | 15 |
| FQ3 (Mar–May) | 0.982 | -1.8% | In line with trend | 14 |
| FQ4 (Jun–Aug) | 1.0907 | +9.1% | +9.1% above trend | 14 |
How Spending Drives Revenue
Want this analysis for your portfolio?
I build custom revenue intelligence reports for investors and companies using SEC filing data, econometric modeling, and AI-powered insights.
Get in Touch