Paychex, Inc. PAYX
Revenue Intelligence Report • 53 quarters of SEC filing data • Updated 2026-03-15
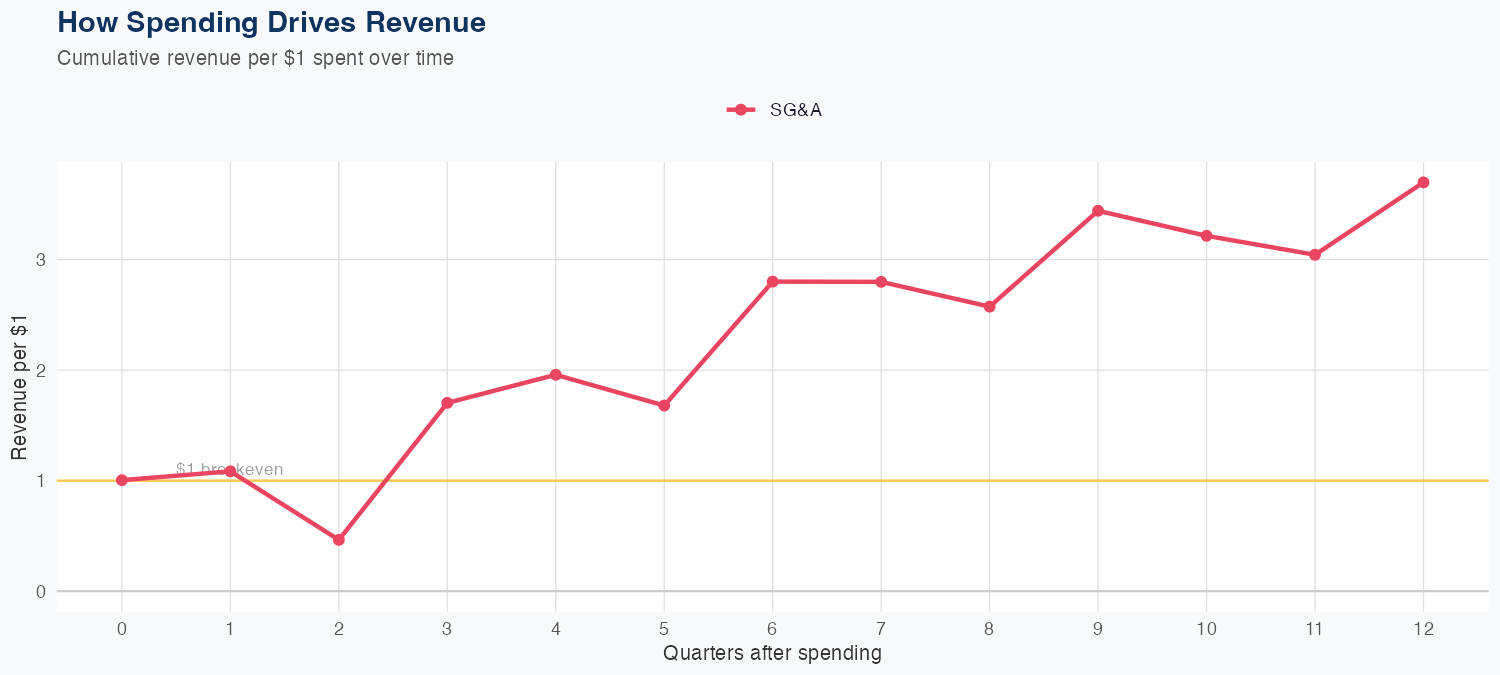
Revenue is driven by SG&A efficiency, with every $1 of SG&A spending generating $3.80 in long-run revenue. The underlying model is linear, built on 53 quarters of data, with 2.5% MAPE and holdout error of 4.5% (predicted $1.50B vs actual $1.60B). The FY forecast calls for $6.7B in revenue, a 13.7% year-over-year increase, signaling continued growth momentum. The dataset lacks R&D data, but the SG&A-driven ROI and the strong forecast point to a constructive outlook for investors.
Investment Thesis
Our ARDL model tracks Paychex, Inc.'s revenue with exceptional precision (2.5% MAPE), indicating highly predictable cash flows. Each $1 of SG&A spending generates $3.80 in revenue, reflecting strong commercial efficiency.
Revenue Forecast
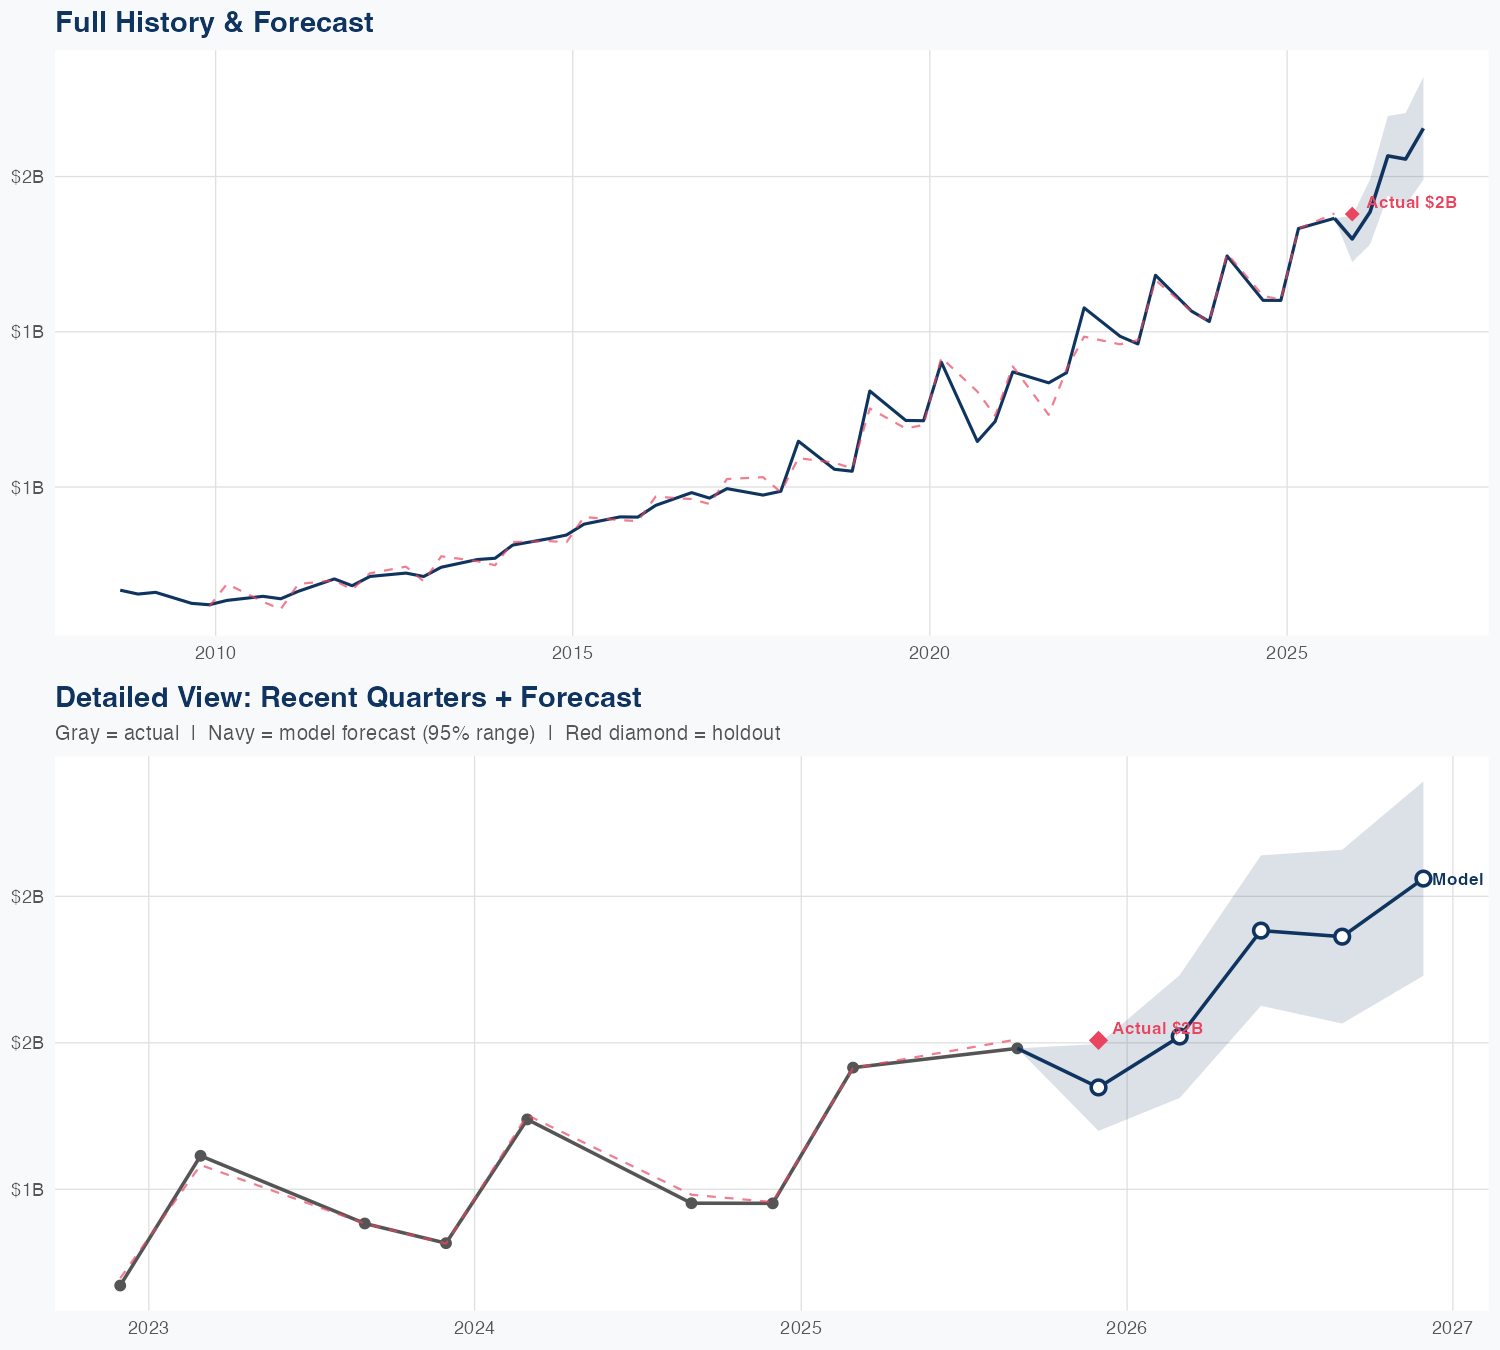
Quarterly Detail
| Quarter | Model Forecast | Actual | 95% Range | YoY Growth | Status |
|---|---|---|---|---|---|
| Q4 2025 | $1.5B | $1.6B | $1.4B – $1.5B | +12.8% | ✗ Outside range |
| Q1 2026 | $1.6B | $1.5B – $1.6B | +18.4% | ||
| Q2 2026 | $1.7B | $1.6B – $1.8B | +13.1% | ||
| Q3 2026 | $1.7B | $1.6B – $1.8B | +10.0% | ||
| Q4 2026 | $1.8B | $1.6B – $1.9B | +14.1% |
Seasonal Factors
| Fiscal Quarter | Seasonal Factor | vs Trend | Interpretation | Obs. |
|---|---|---|---|---|
| FQ1 (Sep–Nov) | 1.0098 | +1.0% | In line with trend | 17 |
| FQ2 (Dec–Feb) | 0.9864 | -1.4% | In line with trend | 16 |
| FQ3 (Mar–May) | 1.0 | +0.0% | In line with trend | 0 |
| FQ4 (Jun–Aug) | 1.008 | +0.8% | In line with trend | 16 |
How Spending Drives Revenue
Want this analysis for your portfolio?
I build custom revenue intelligence reports for investors and companies using SEC filing data, econometric modeling, and AI-powered insights.
Get in Touch