Ppg Industries, Inc. PPG
Revenue Intelligence Report • 70 quarters of SEC filing data • Updated 2026-03-15
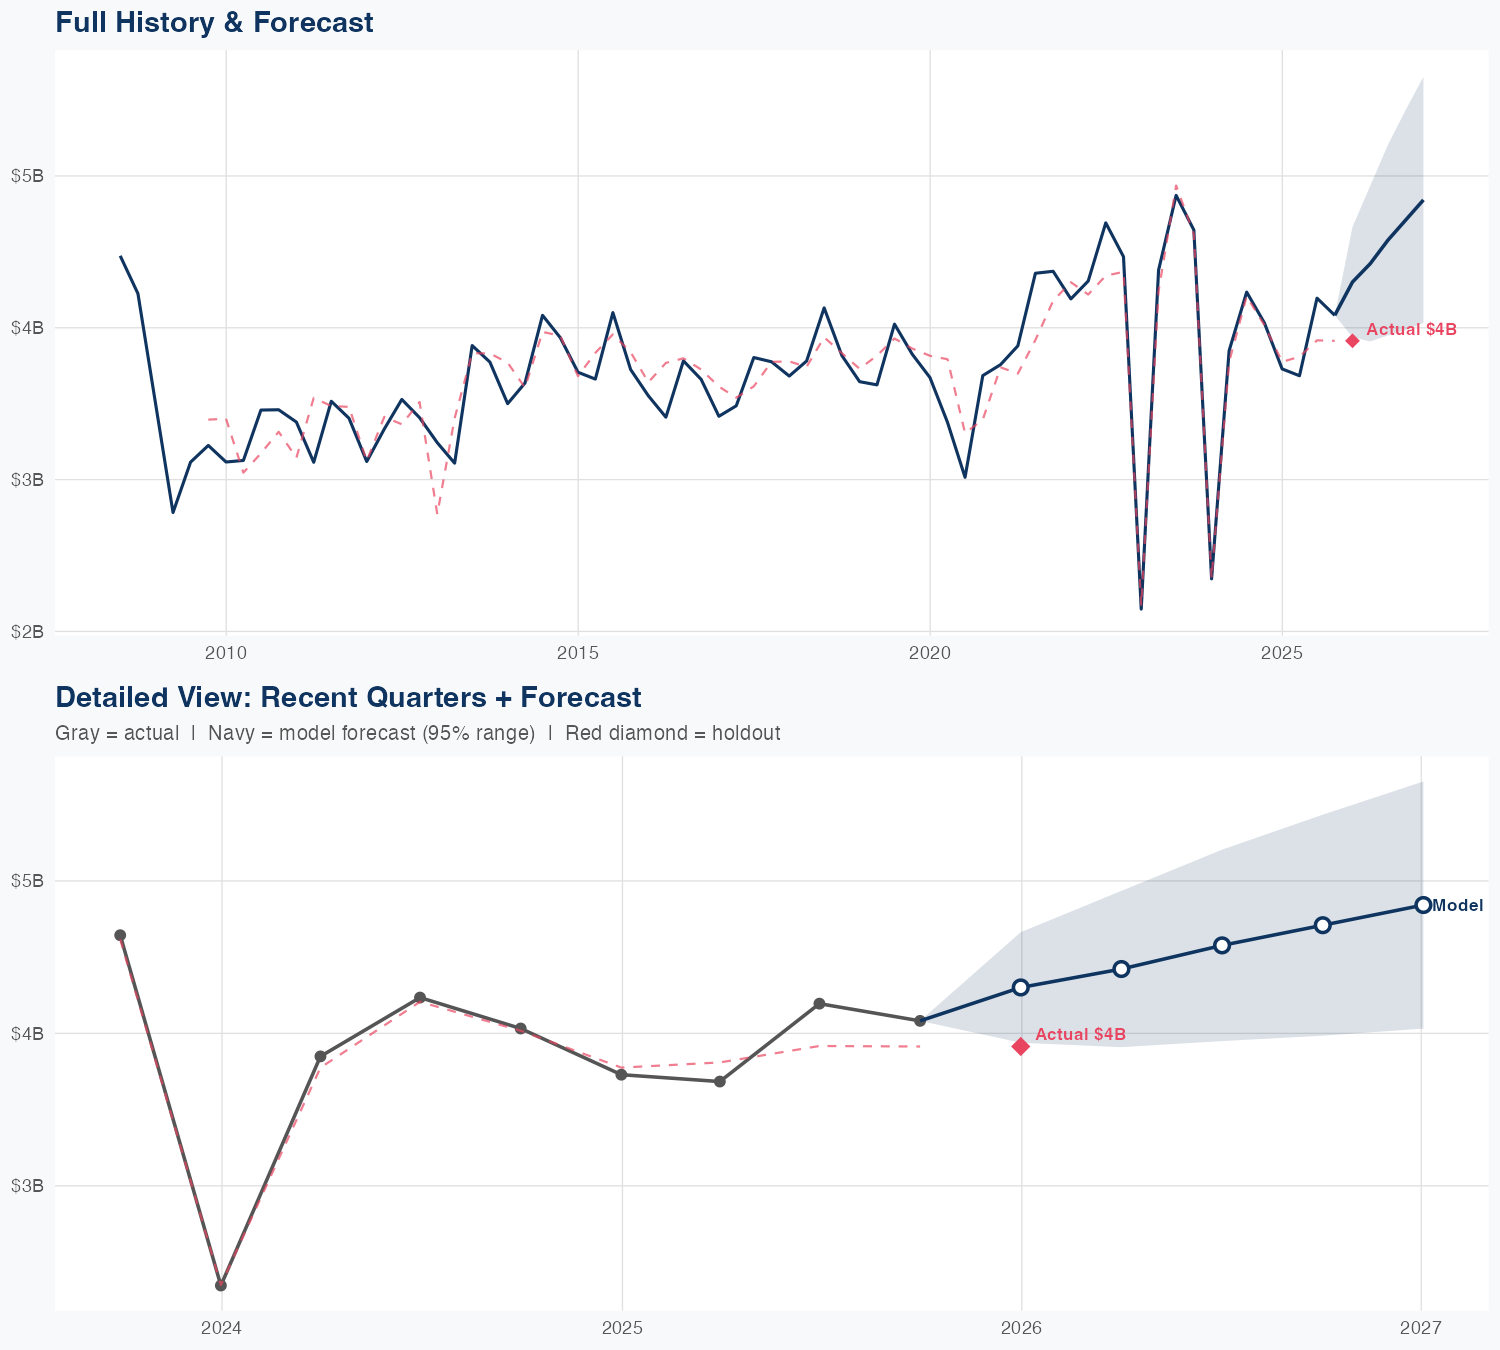
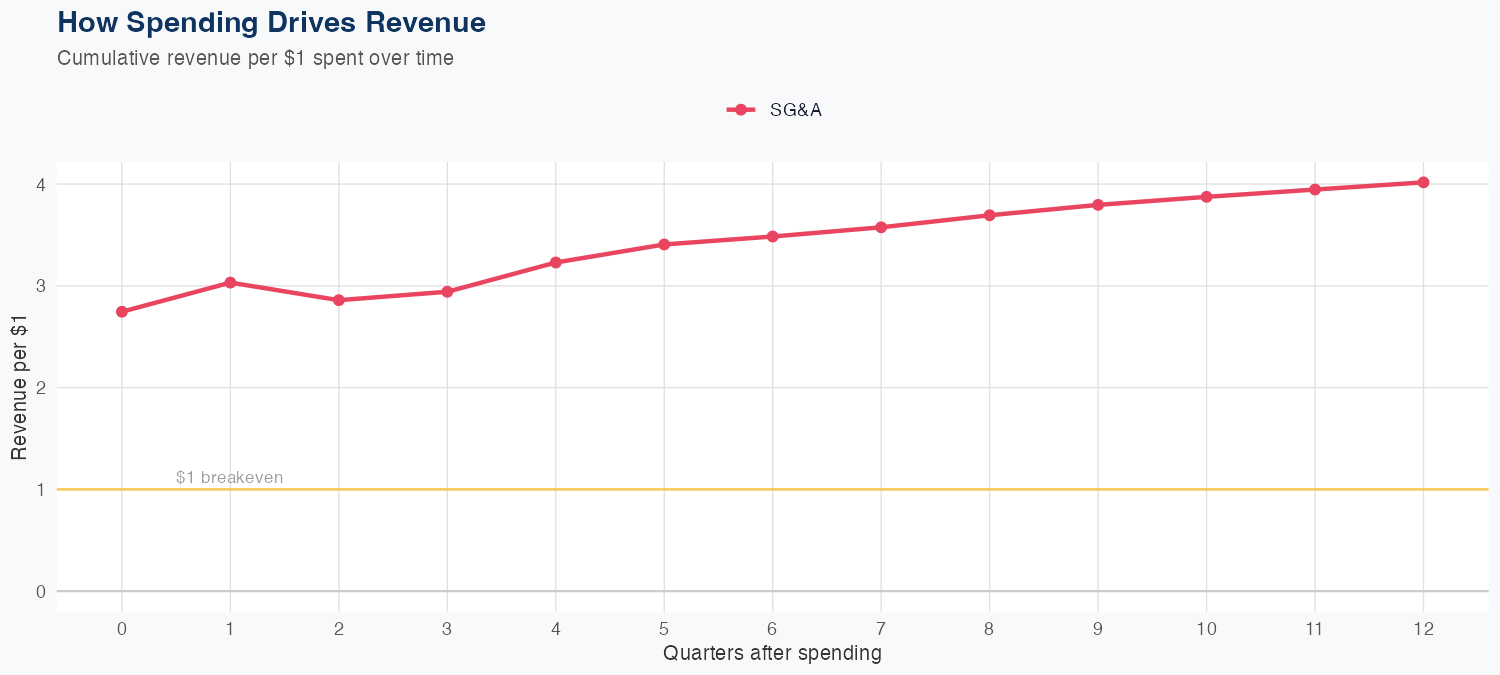
Revenue is driven by SG&A efficiency, with every $1 of SG&A spending generating about $4.02 in long-run revenue, indicating strong operating-leverage in the expense base. The latest quarterly revenue came in at $3.914 billion, while holdout testing produced a forecast of $4.3 billion versus actual $3.9 billion, a roughly 9.9% miss that suggests the model is reasonably accurate but not perfect in the near term. The FY revenue forecast stands around $19.0 billion, up about 16.9% year over year, signaling a solid growth outlook under the current spending framework. Note that R&D data are not available in the dataset, so the impact of R&D on growth cannot be assessed from these inputs.
Investment Thesis
The econometric model achieves strong accuracy (3.9% MAPE), suggesting Ppg Industries, Inc.'s revenue trajectory is well-characterized by its spending patterns. Each $1 of SG&A spending generates $4.02 in revenue, reflecting strong commercial efficiency.
Revenue Forecast
Quarterly Detail
| Quarter | Model Forecast | Actual | 95% Range | YoY Growth | Status |
|---|---|---|---|---|---|
| Q4 2025 | $4.3B | $3.9B | $3.9B – $4.7B | +15.3% | ✗ Outside range |
| Q2 2026 | $4.4B | $3.9B – $4.9B | +20.0% | ||
| Q3 2026 | $4.6B | $3.9B – $5.2B | +9.1% | ||
| Q4 2026 | $4.7B | $4.0B – $5.4B | +15.4% | ||
| Q1 2027 | $4.8B | $4.0B – $5.7B | +23.7% |
Seasonal Factors
| Fiscal Quarter | Seasonal Factor | vs Trend | Interpretation | Obs. |
|---|---|---|---|---|
| FQ1 (Sep–Nov) | 0.9969 | -0.3% | In line with trend | 17 |
| FQ2 (Dec–Feb) | 0.9773 | -2.3% | In line with trend | 17 |
| FQ3 (Mar–May) | 0.9849 | -1.5% | In line with trend | 16 |
| FQ4 (Jun–Aug) | 1.0362 | +3.6% | +3.6% above trend | 16 |
How Spending Drives Revenue
Want this analysis for your portfolio?
I build custom revenue intelligence reports for investors and companies using SEC filing data, econometric modeling, and AI-powered insights.
Get in Touch