Steel Dynamics, Inc. STLD
Revenue Intelligence Report • 43 quarters of SEC filing data • Updated 2026-03-15
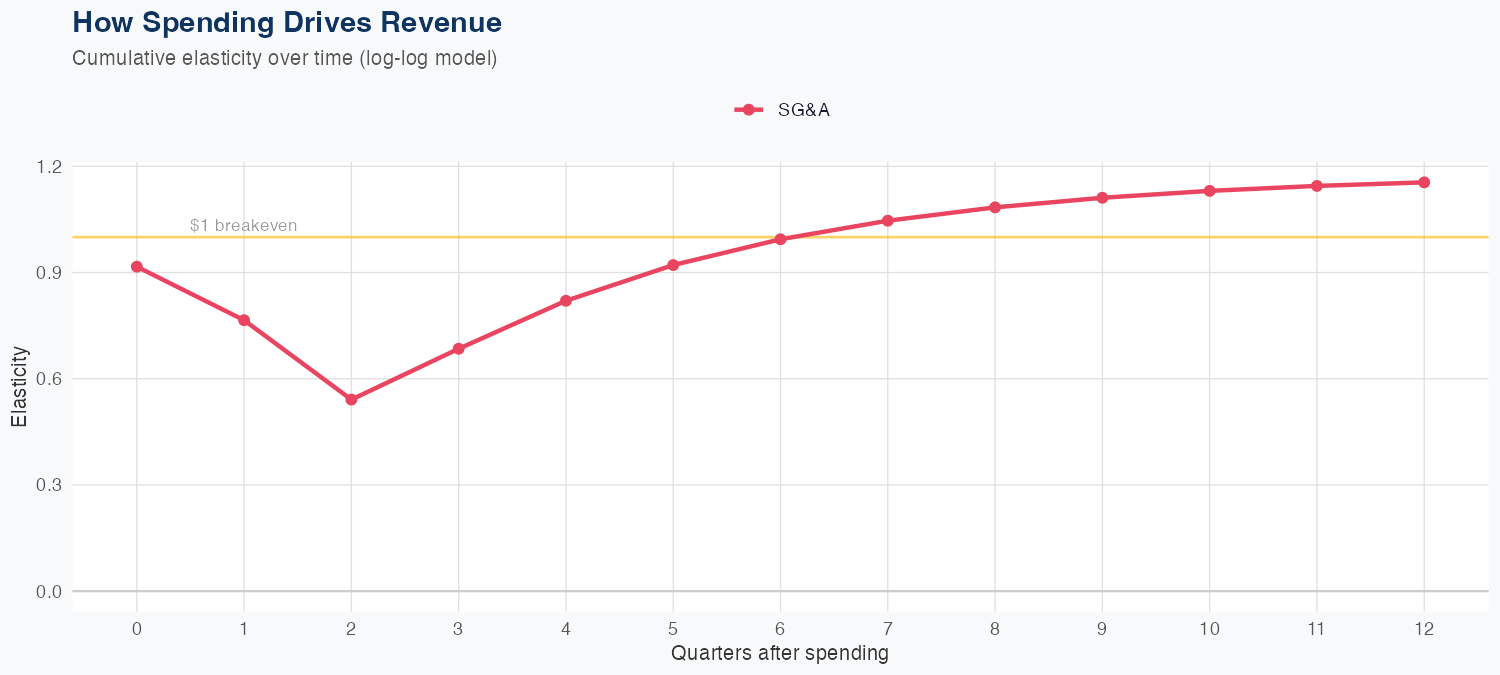
Using a log-log framework, revenue appears driven by SG&A spending with an elasticity of 1.15, meaning a 1% rise in SG&A is associated with about a 1.15% lift in revenue, so SG&A investments act as a lever for topline growth. The model achieves a 7.5% MAPE but exhibits holdout overprediction (predicted $4.9B vs actual $4.4B, -11.7%), signaling positive revenue leverage from spending with some forecast uncertainty. The implied ROI of SG&A spending is positive in terms of revenue contribution, but profitability depends on margins that the data provided do not reveal. The FY outlook shows revenue near $22B, up about 20.6% year over year, indicating strong growth momentum while prompting close monitoring of cost efficiency to translate top-line gains into earnings.
Investment Thesis
The econometric model achieves strong accuracy (7.5% MAPE), suggesting Steel Dynamics, Inc.'s revenue trajectory is well-characterized by its spending patterns. Sales & marketing spend shows a 1.15x elasticity, suggesting effective go-to-market execution.
Revenue Forecast
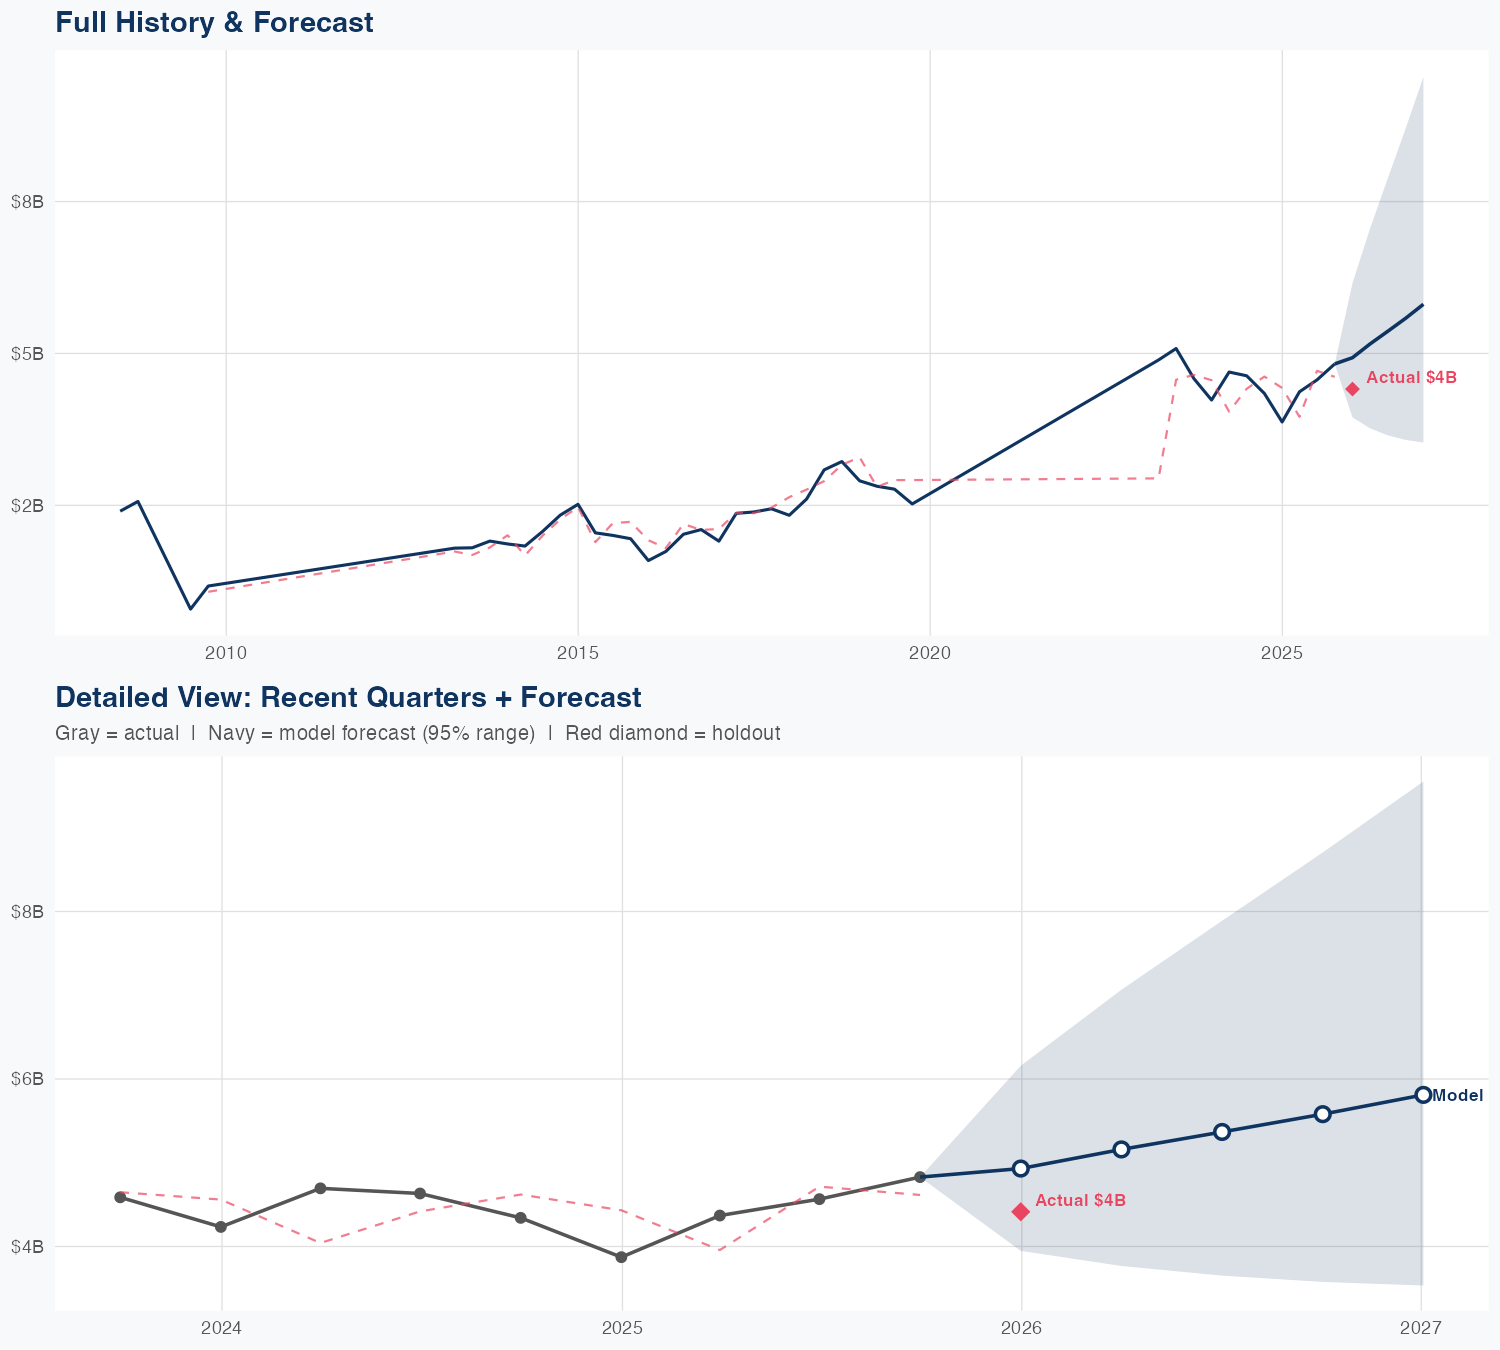
Quarterly Detail
| Quarter | Model Forecast | Actual | 95% Range | YoY Growth | Status |
|---|---|---|---|---|---|
| Q4 2025 | $4.9B | $4.4B | $3.9B – $6.2B | +27.3% | ✓ In range |
| Q2 2026 | $5.2B | $3.8B – $7.1B | +18.1% | ||
| Q3 2026 | $5.4B | $3.7B – $7.9B | +17.6% | ||
| Q4 2026 | $5.6B | $3.6B – $8.7B | +15.6% | ||
| Q1 2027 | $5.8B | $3.5B – $9.6B | +31.7% |
Seasonal Factors
| Fiscal Quarter | Seasonal Factor | vs Trend | Interpretation | Obs. |
|---|---|---|---|---|
| FQ1 (Sep–Nov) | 1.003 | +0.3% | In line with trend | 11 |
| FQ2 (Dec–Feb) | 0.9051 | -9.5% | -9.5% below trend | 9 |
| FQ3 (Mar–May) | 1.0803 | +8.0% | +8.0% above trend | 10 |
| FQ4 (Jun–Aug) | 1.0348 | +3.5% | +3.5% above trend | 10 |
How Spending Drives Revenue
Want this analysis for your portfolio?
I build custom revenue intelligence reports for investors and companies using SEC filing data, econometric modeling, and AI-powered insights.
Get in Touch