Teradyne, Inc. TER
Revenue Intelligence Report • 8 quarters of SEC filing data • Updated 2026-03-15
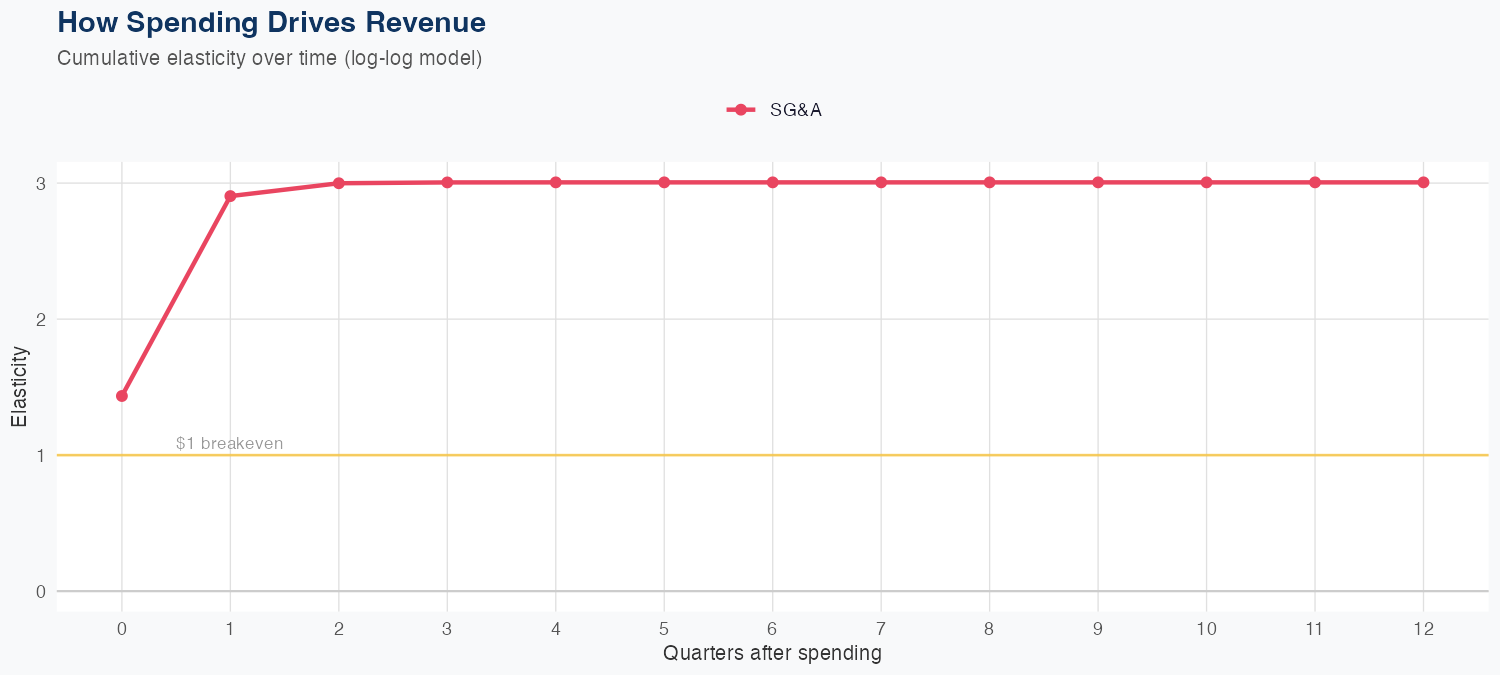
Revenue growth appears driven by SG&A spending, with a 1% increase in SG&A associated with a 3.01% rise in revenue under the log-log model. The model’s accuracy is moderate, with a 10.7% MAPE and a holdout test showing predicted 0.9B versus actual 1.1B (18.9% error). The FY forecast implies revenue of about $3.9B, up roughly 22% year over year, signaling solid growth potential if SG&A-driven dynamics persist. R&D data is not available and the ROI of SG&A investments is inferred rather than quantified, so investors should monitor margins and confirm that SG&A-driven revenue translates into durable profitability.
Investment Thesis
At 10.7% MAPE, the model captures Teradyne, Inc.'s broad revenue trajectory, though quarterly variability suggests sensitivity to external factors. Sales & marketing spend shows a 3.01x elasticity, suggesting effective go-to-market execution.
Revenue Forecast
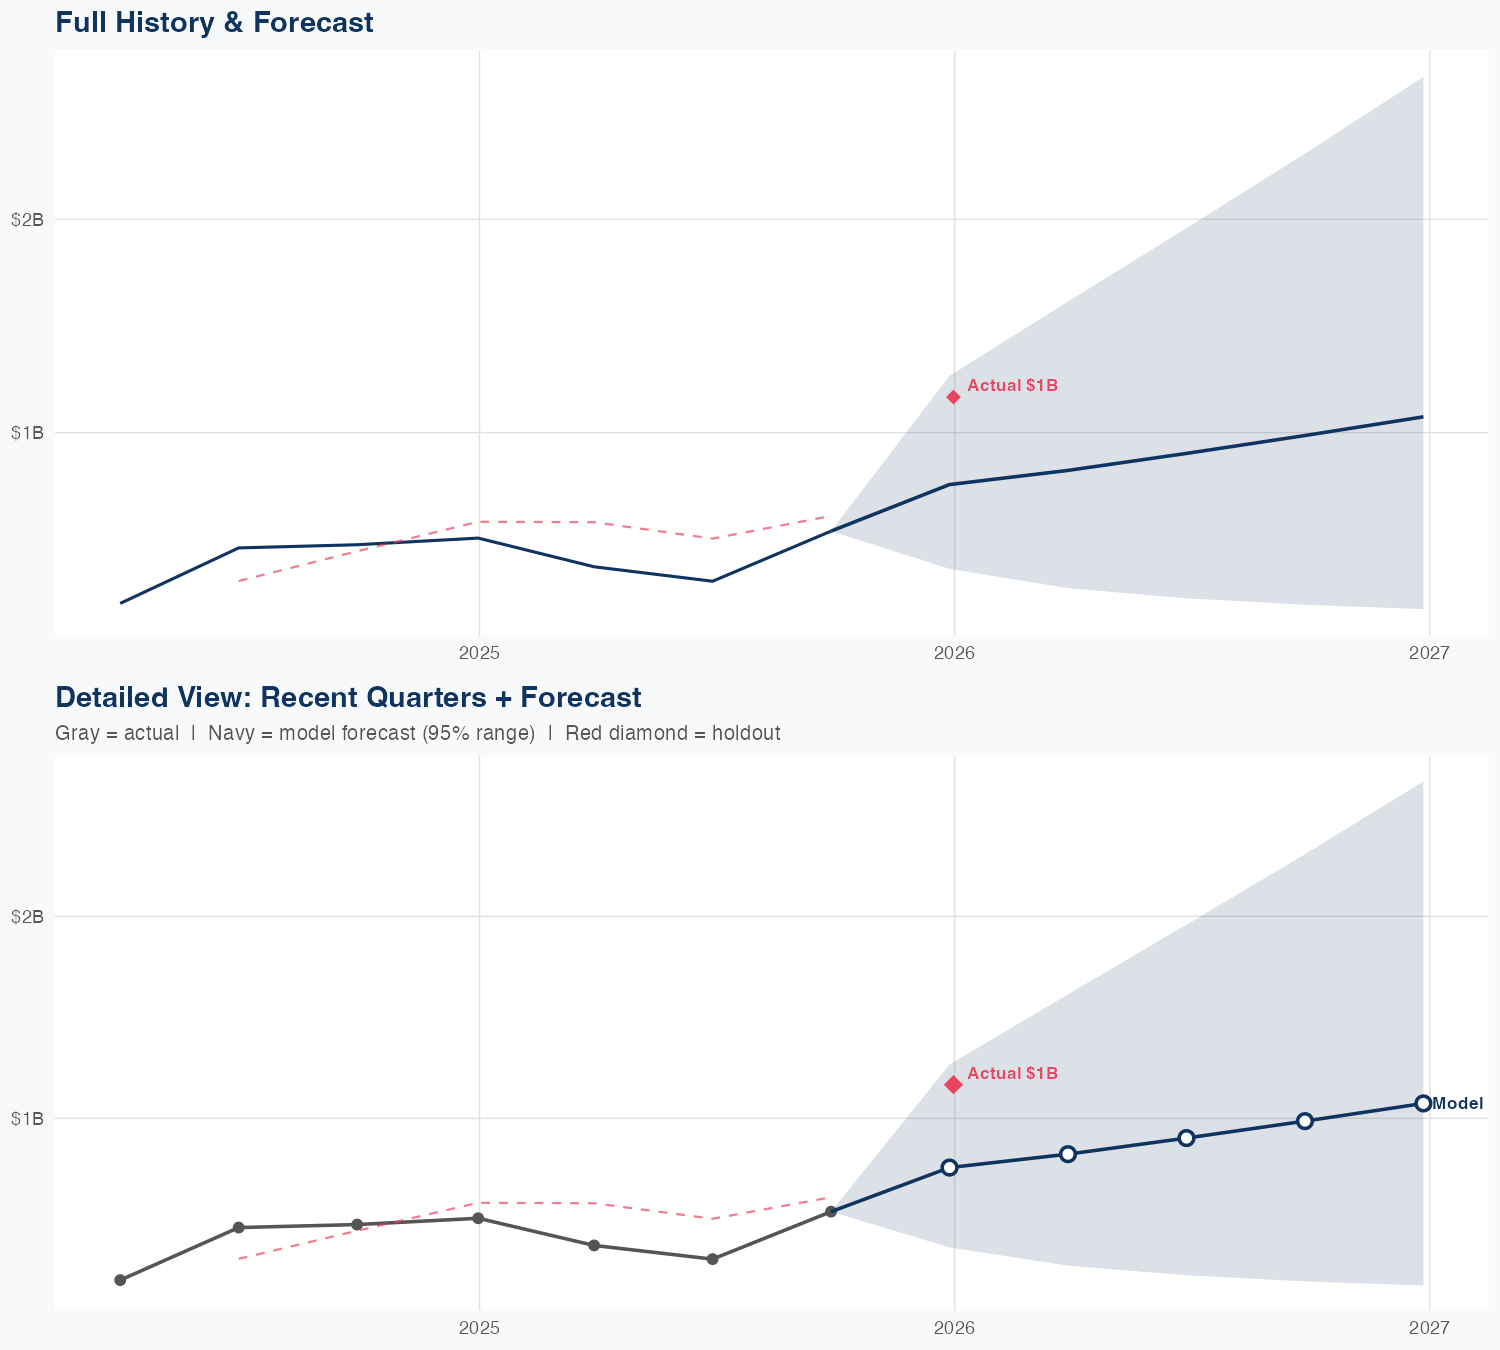
Quarterly Detail
| Quarter | Model Forecast | Actual | 95% Range | YoY Growth | Status |
|---|---|---|---|---|---|
| Q4 2025 | $0.9B | $1.1B | $0.7B – $1.1B | +16.7% | ✓ In range |
| Q1 2026 | $0.9B | $0.6B – $1.3B | +32.9% | ||
| Q2 2026 | $1.0B | $0.6B – $1.5B | +45.9% | ||
| Q3 2026 | $1.0B | $0.6B – $1.7B | +29.1% | ||
| Q4 2026 | $1.0B | $0.6B – $1.8B | -4.3% |
How Spending Drives Revenue
Want this analysis for your portfolio?
I build custom revenue intelligence reports for investors and companies using SEC filing data, econometric modeling, and AI-powered insights.
Get in Touch