Target Corporation TGT
Revenue Intelligence Report • 70 quarters of SEC filing data • Updated 2026-03-15
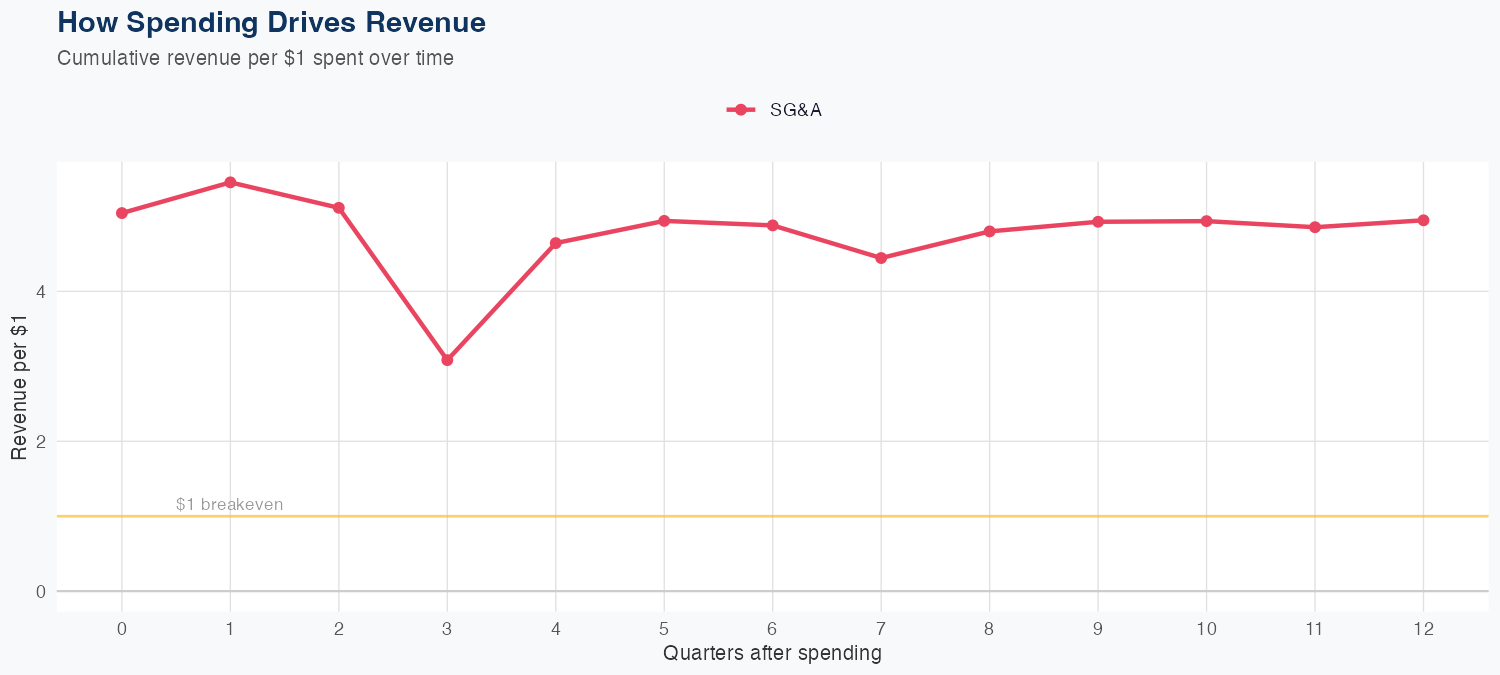
Target reported revenue of about $101 billion, down 3.5% year over year, underscoring ongoing demand weakness in a highly competitive retail environment. In our econometric model, SG&A elasticity is 0.98x, meaning SG&A tracks revenue almost one-for-one and there is little operating leverage to cushion a topline miss. Our model's MAPE of 2.7% implies a solid average fit, but the holdout underpredicted by 7.6% (predicted $28.1B vs $30.5B actual), signaling forecast risk and potential drift from episodic factors not captured by the long-run specification. With growth tied to topline momentum rather than efficiency gains, margins rely on gross margin, pricing, and mix, making Target particularly sensitive to consumer sentiment, promotional intensity, and competitive dynamics.
Investment Thesis
Our ARDL model tracks Target Corporation's revenue with exceptional precision (2.7% MAPE), indicating highly predictable cash flows. Sales & marketing spend shows a 0.98x elasticity, suggesting effective go-to-market execution.
Revenue Forecast
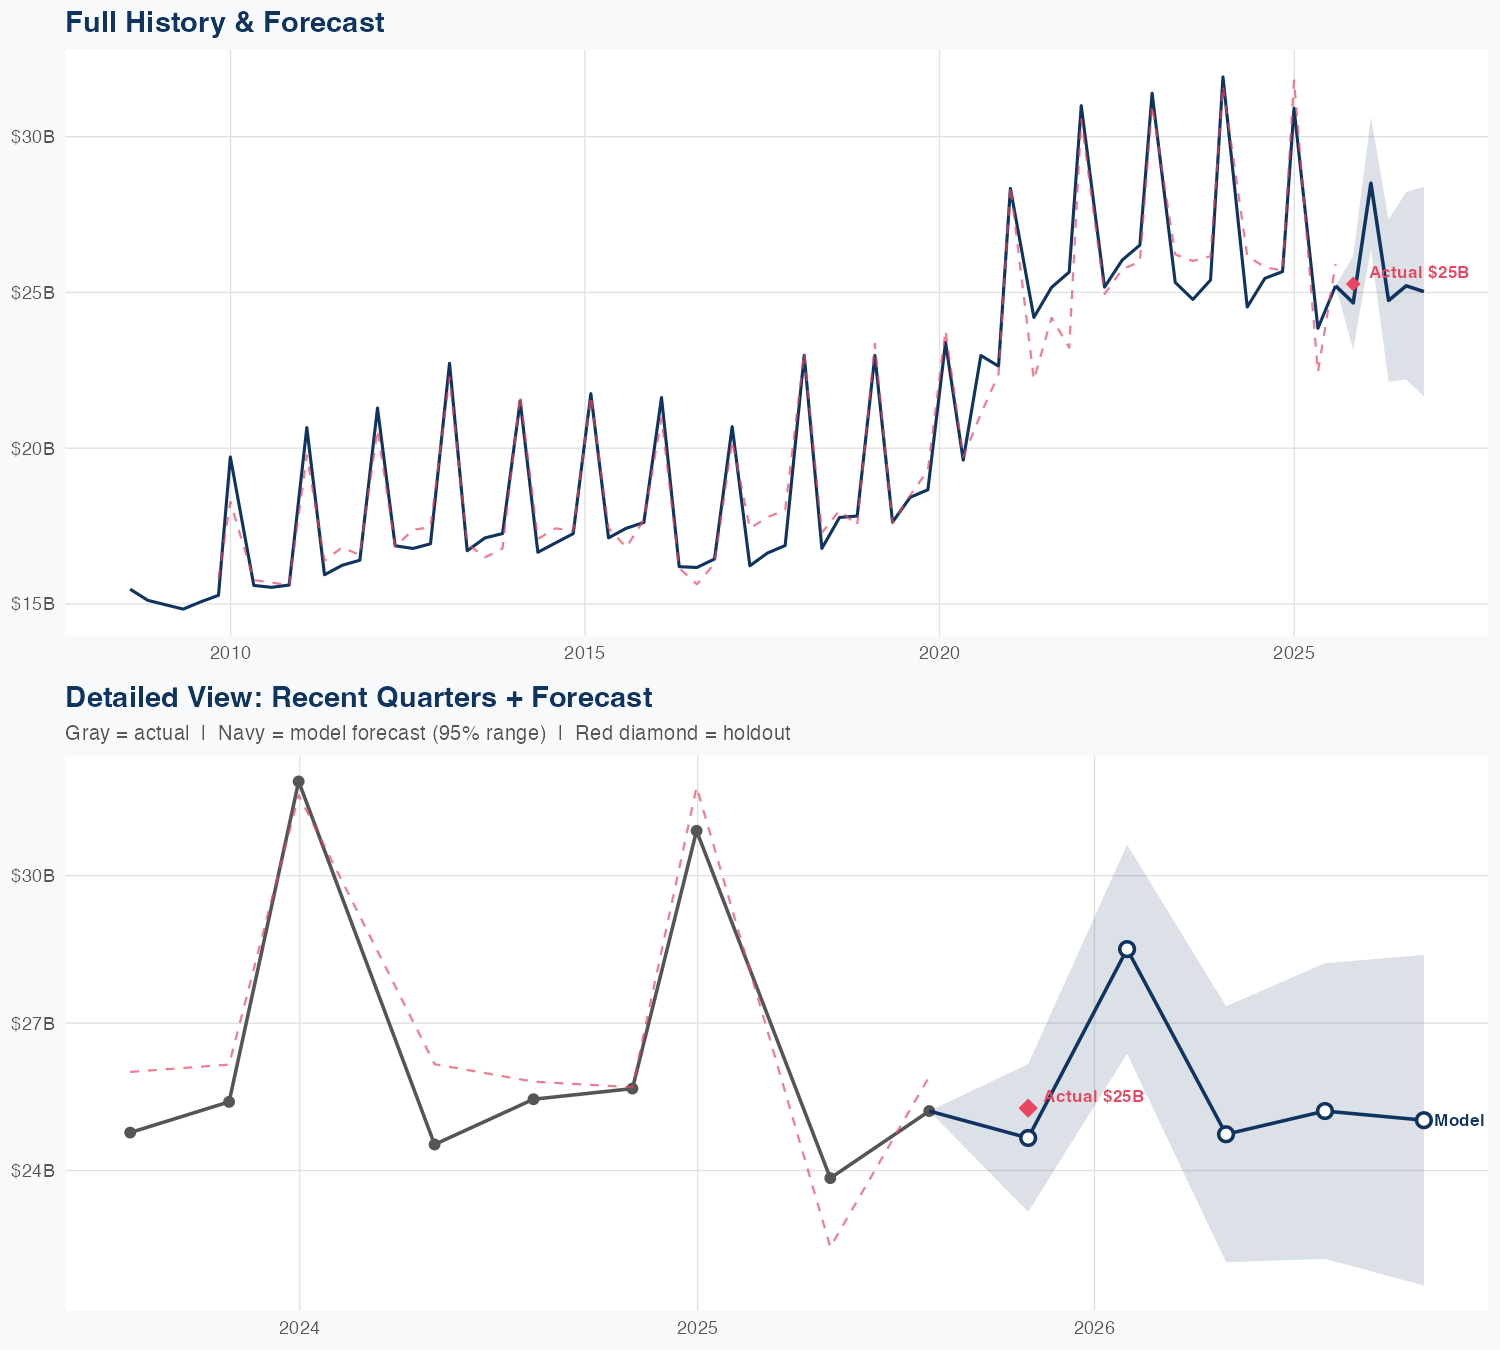
Quarterly Detail
| Quarter | Model Forecast | Actual | 95% Range | YoY Growth | Status |
|---|---|---|---|---|---|
| Q1 2026 | $28B | $30B | $26B – $30B | -9.0% | ✗ Outside range |
| Q2 2026 | $25B | $23B – $28B | +4.9% | ||
| Q3 2026 | $25B | $22B – $28B | -0.7% | ||
| Q4 2026 | $25B | $22B – $29B | -0.5% | ||
| Q1 2027 | $26B | $22B – $30B | -14.8% |
Seasonal Factors
| Fiscal Quarter | Seasonal Factor | vs Trend | Interpretation | Obs. |
|---|---|---|---|---|
| FQ1 (Sep–Nov) | 0.9998 | -0.0% | In line with trend | 17 |
| FQ2 (Dec–Feb) | 1.0094 | +0.9% | In line with trend | 17 |
| FQ3 (Mar–May) | 0.9946 | -0.5% | In line with trend | 16 |
| FQ4 (Jun–Aug) | 0.9908 | -0.9% | In line with trend | 16 |
How Spending Drives Revenue
Want this analysis for your portfolio?
I build custom revenue intelligence reports for investors and companies using SEC filing data, econometric modeling, and AI-powered insights.
Get in Touch