The Tjx Companies, Inc. TJX
Revenue Intelligence Report • 57 quarters of SEC filing data • Updated 2026-03-15
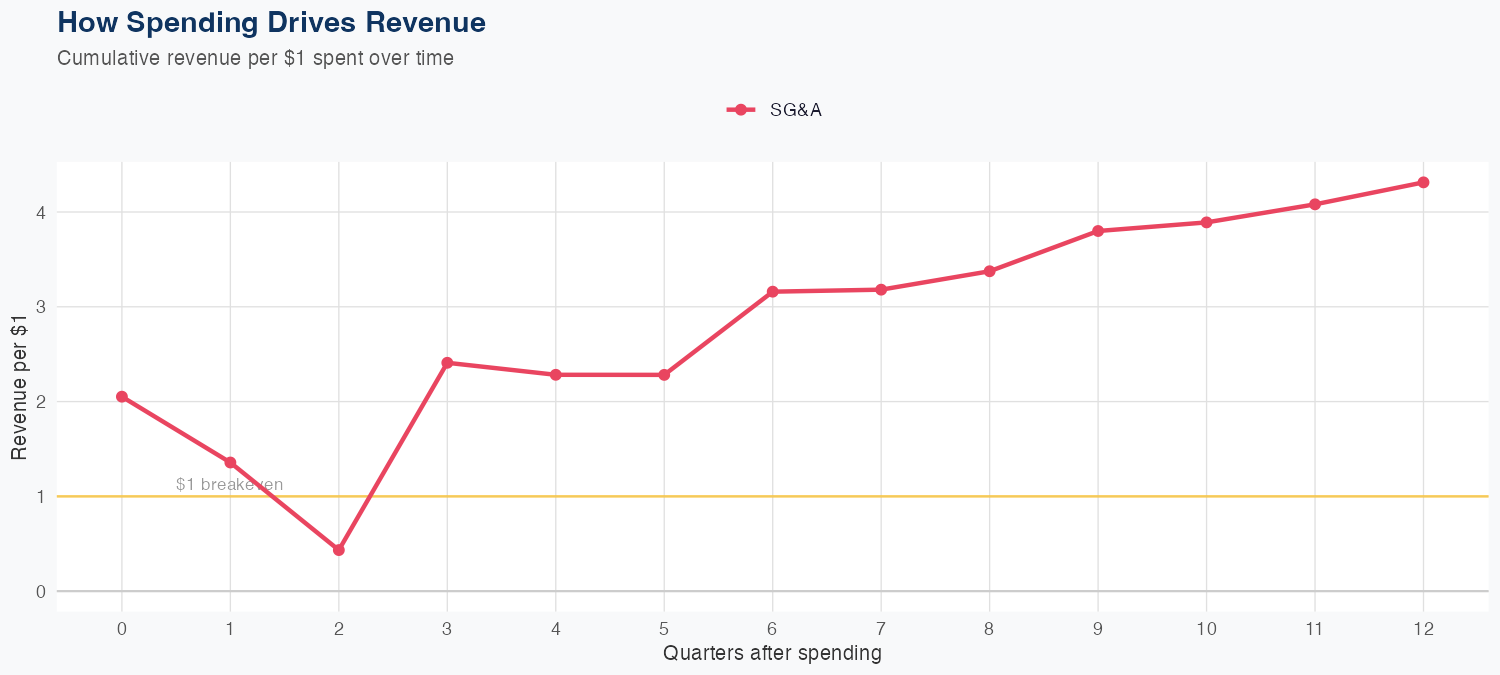
Revenue is anchored in the off-price merchandising model and an expansive store network, which supports durable top-line growth. The SG&A spend shows a strong implied ROI, with $1 of SG&A generating $4.48 of long-run revenue, indicating efficient cost-to-revenue leverage. The model is linear with 3.5% MAPE across 57 quarters, but a holdout produced a 14B forecast vs 15B actual (5.4% error), signaling reasonable predictability with some quarterly volatility. The FY revenue forecast is about $56B, down roughly 4.7% year over year, implying a cautious near-term outlook even as promotions and store economics support revenue stability.
Investment Thesis
The econometric model achieves strong accuracy (3.5% MAPE), suggesting The Tjx Companies, Inc.'s revenue trajectory is well-characterized by its spending patterns. Each $1 of SG&A spending generates $4.48 in revenue, reflecting strong commercial efficiency.
Revenue Forecast
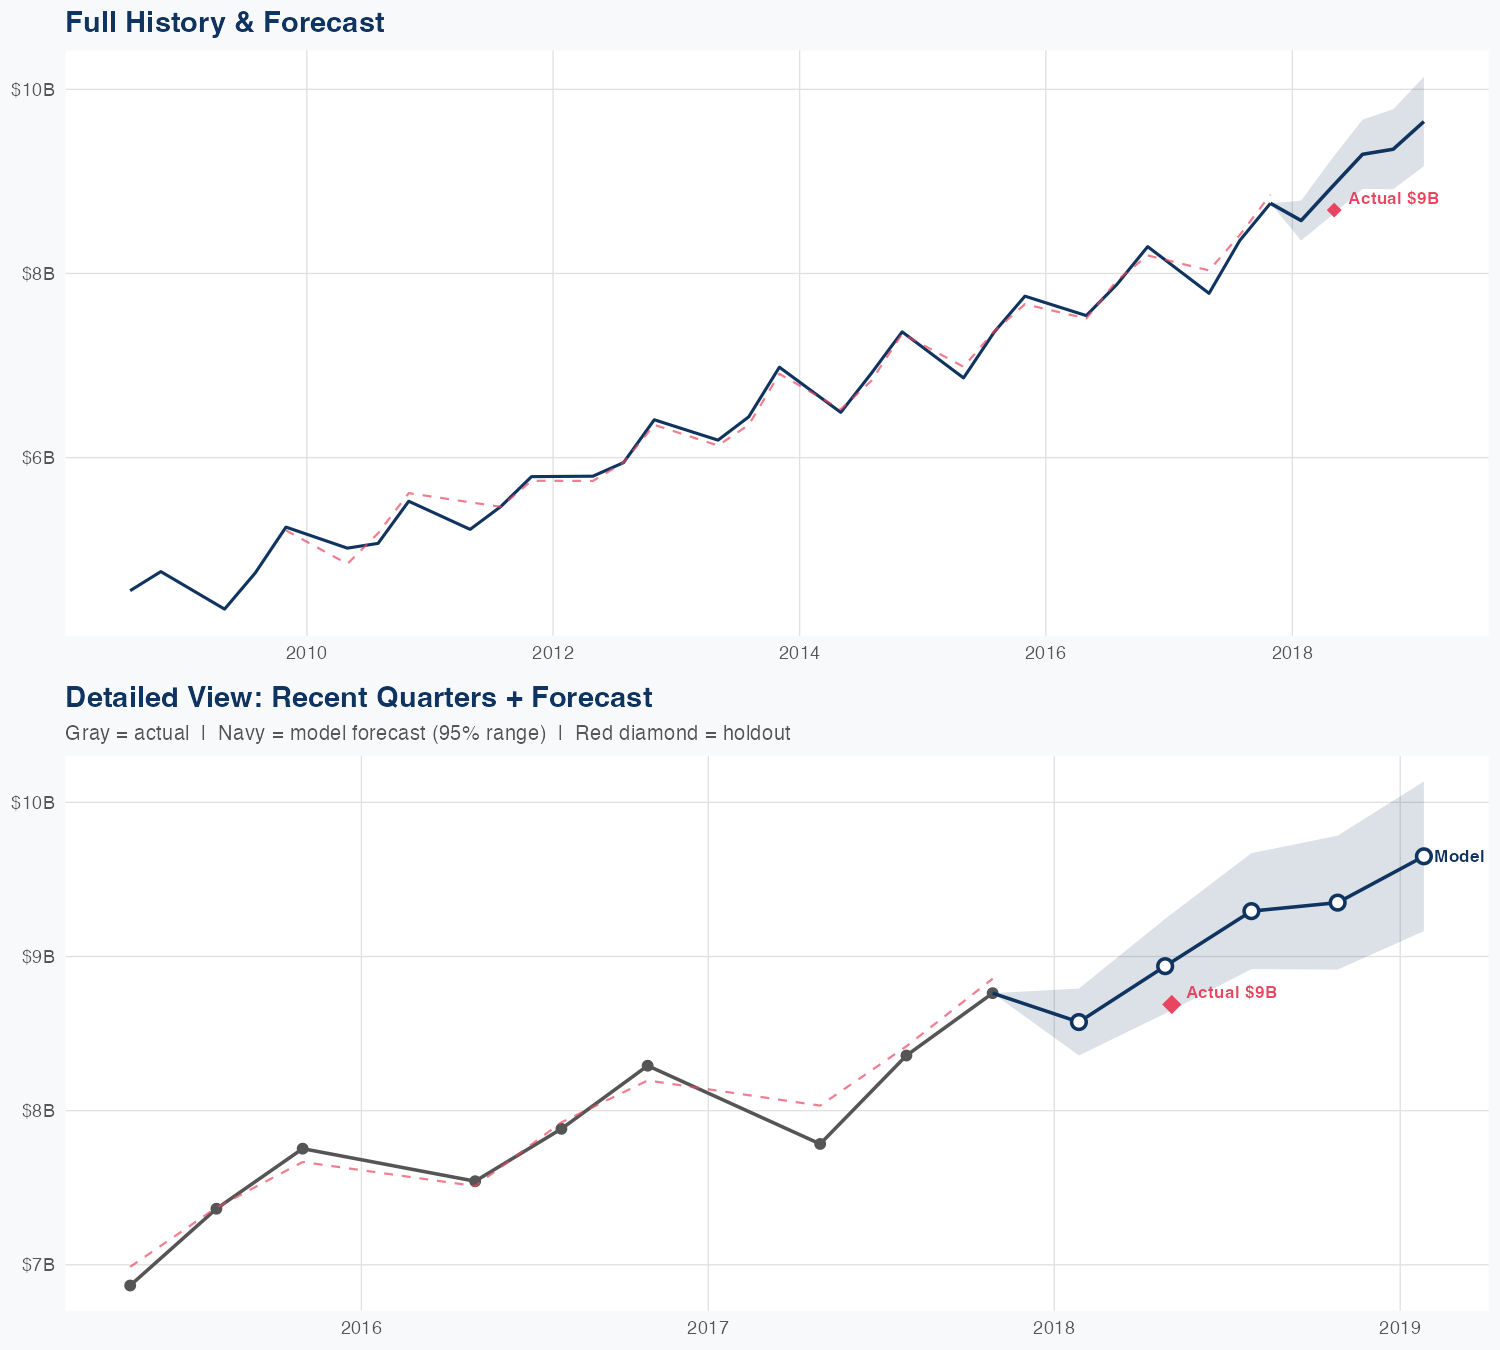
Quarterly Detail
| Quarter | Model Forecast | Actual | 95% Range | YoY Growth | Status |
|---|---|---|---|---|---|
| Q4 2025 | $14B | $15B | $13B – $15B | +1.7% | ✓ In range |
| Q1 2026 | $14B | $13B – $15B | -15.5% | ||
| Q2 2026 | $14B | $13B – $16B | +7.7% | ||
| Q3 2026 | $14B | $12B – $16B | -2.0% | ||
| Q4 2026 | $14B | $12B – $16B | -6.4% |
Seasonal Factors
| Fiscal Quarter | Seasonal Factor | vs Trend | Interpretation | Obs. |
|---|---|---|---|---|
| FQ1 (Sep–Nov) | 0.9998 | -0.0% | In line with trend | 17 |
| FQ2 (Dec–Feb) | 1.018 | +1.8% | In line with trend | 4 |
| FQ3 (Mar–May) | 1.021 | +2.1% | In line with trend | 16 |
| FQ4 (Jun–Aug) | 1.0127 | +1.3% | In line with trend | 16 |
How Spending Drives Revenue
Want this analysis for your portfolio?
I build custom revenue intelligence reports for investors and companies using SEC filing data, econometric modeling, and AI-powered insights.
Get in Touch