Trimble Inc. TRMB
Revenue Intelligence Report • 65 quarters of SEC filing data • Updated 2026-03-15
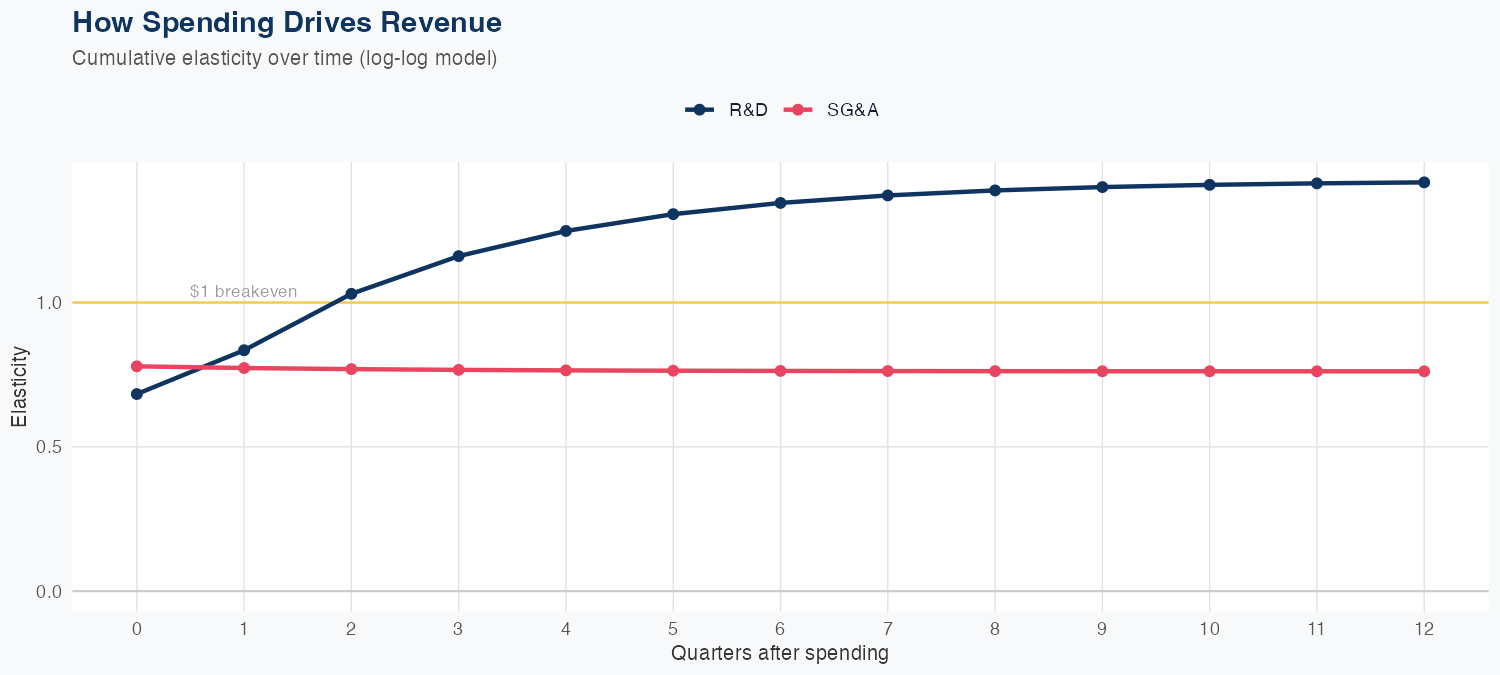
Revenue is driven by disciplined spending in R&D and SG&A, with each $1 of R&D spending generating about $21.43 of long-run revenue and each $1 of SG&A generating about $3.55. The model is linear but exhibits questionable accuracy overall (MAPE 301.1%), though a holdout test on the latest quarter predicted $905M versus $970M actual, a 6.7% error. The FY revenue forecast is $3,079M, down 14.2% year over year, signaling near-term headwinds. Investors should note the outsized ROI on R&D relative to SG&A, suggesting growth upside if demand supports continued investment, but the revenue decline and model reliability warrant cautious interpretation.
Investment Thesis
At 301.1% MAPE, the model captures Trimble Inc.'s broad revenue trajectory, though quarterly variability suggests sensitivity to external factors. Every $1 of R&D investment is associated with $21.43 of revenue, indicating efficient capital deployment in innovation. Each $1 of SG&A spending generates $3.55 in revenue, reflecting strong commercial efficiency.
Revenue Forecast
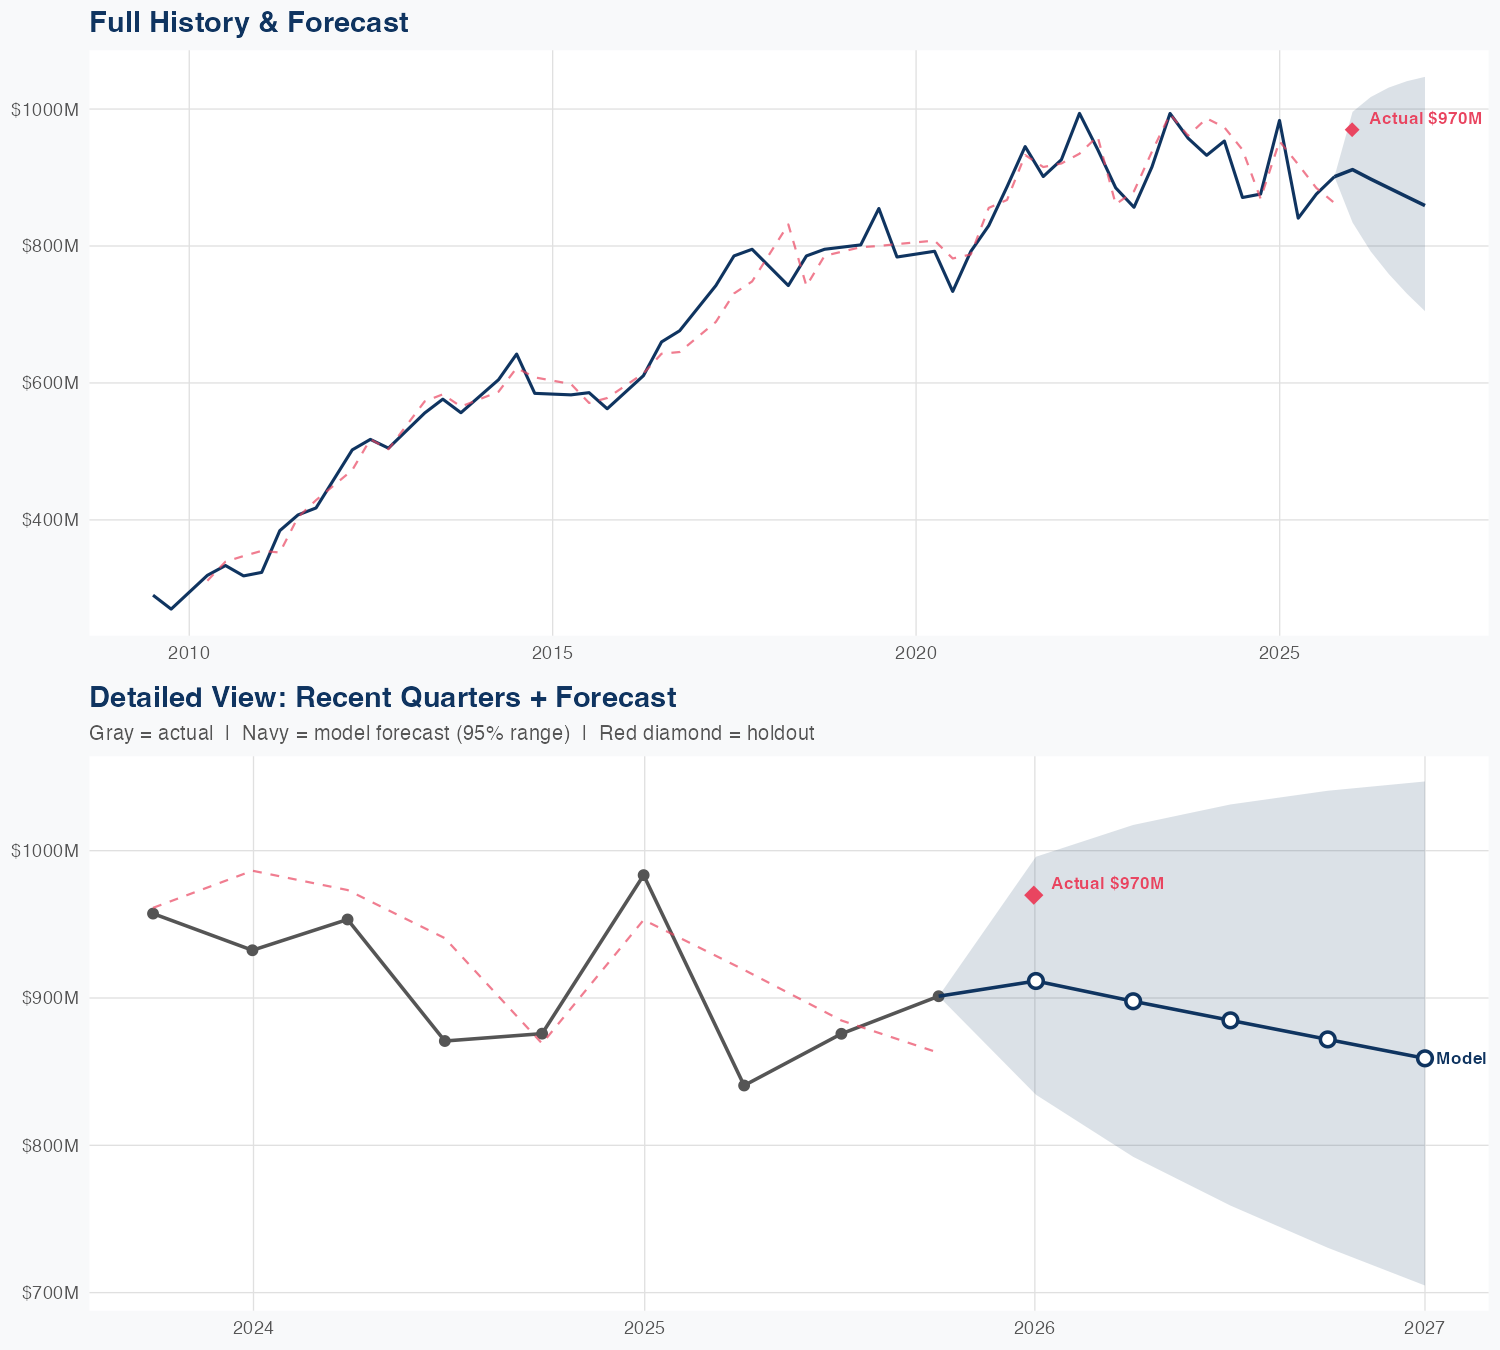
Quarterly Detail
| Quarter | Model Forecast | Actual | 95% Range | YoY Growth | Status |
|---|---|---|---|---|---|
| Q1 2026 | $905B | $970B | $686B – $1124B | -8.0% | ✓ In range |
| Q2 2026 | $784B | $475B – $1093B | -6.7% | ||
| Q3 2026 | $763B | $384B – $1141B | -12.9% | ||
| Q4 2026 | $767B | $330B – $1205B | -14.8% | ||
| Q1 2027 | $765B | $276B – $1254B | -21.1% |
Seasonal Factors
| Fiscal Quarter | Seasonal Factor | vs Trend | Interpretation | Obs. |
|---|---|---|---|---|
| FQ1 (Sep–Nov) | 1.027 | +2.7% | In line with trend | 16 |
| FQ2 (Dec–Feb) | 1.0165 | +1.7% | In line with trend | 14 |
| FQ3 (Mar–May) | 0.9657 | -3.4% | -3.4% below trend | 15 |
| FQ4 (Jun–Aug) | 0.9995 | -0.0% | In line with trend | 15 |
How Spending Drives Revenue
Want this analysis for your portfolio?
I build custom revenue intelligence reports for investors and companies using SEC filing data, econometric modeling, and AI-powered insights.
Get in Touch