Tyson Foods, Inc. TSN
Revenue Intelligence Report • 48 quarters of SEC filing data • Updated 2026-03-15
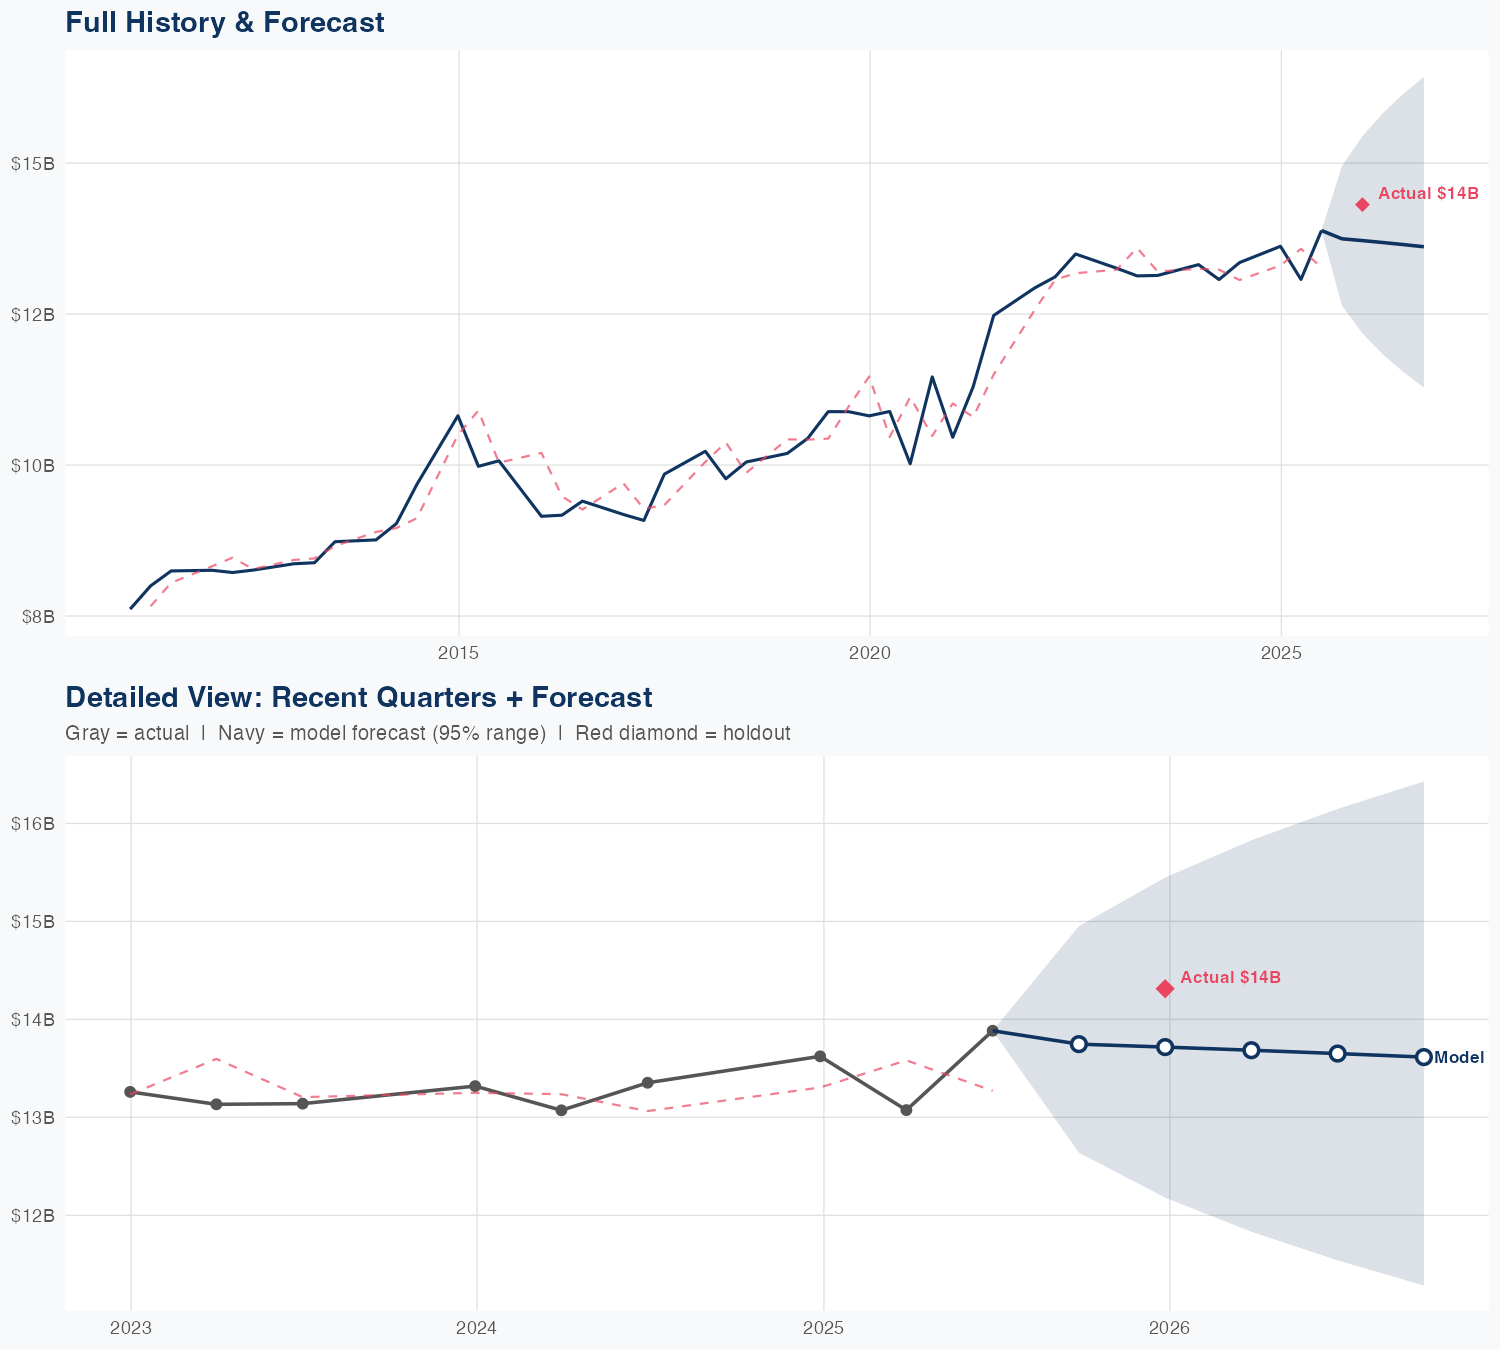
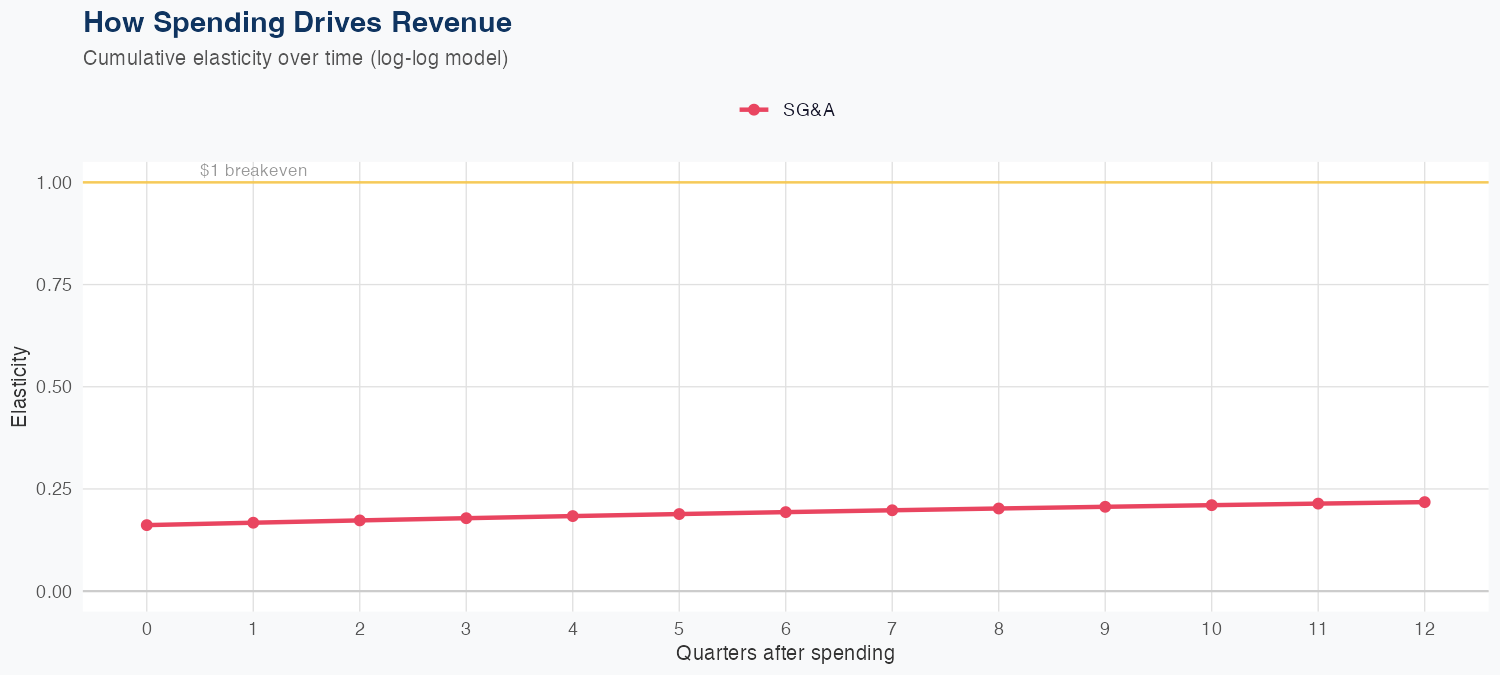
Revenue appears to be driven primarily by SG&A spending, with a log-log elasticity of about 0.22 for every 1% rise in SG&A translating into roughly 0.22% higher revenue; R&D data are not available. The model shows reasonable accuracy (MAPE 3.3%), and holdout testing yields a close forecast (predicted 14.0B vs actual 14.0B, 4.0% error) against the latest quarterly revenue of 14.313B. The FY forecast stands at about 55B in revenue, down 0.4% year-over-year, implying a stable but mildly contracting revenue trajectory relative to an approximate 57B annualized run rate from the latest quarter. ROI on SG&A investments appears modest given the elasticity, underscoring the need for disciplined optimization of selling, general, and administrative spend to support margins as growth remains muted.
Investment Thesis
The econometric model achieves strong accuracy (3.3% MAPE), suggesting Tyson Foods, Inc.'s revenue trajectory is well-characterized by its spending patterns. Sales & marketing spend shows a 0.22x elasticity, suggesting effective go-to-market execution.
Revenue Forecast
Quarterly Detail
| Quarter | Model Forecast | Actual | 95% Range | YoY Growth | Status |
|---|---|---|---|---|---|
| Q3 2025 | $14B | $14B | $13B – $15B | +3.0% | ✓ In range |
| Q4 2025 | $14B | $12B – $15B | +0.7% | ||
| Q1 2026 | $14B | $12B – $16B | +4.7% | ||
| Q2 2026 | $14B | $12B – $16B | -1.7% | ||
| Q3 2026 | $14B | $11B – $16B | -4.9% |
Seasonal Factors
| Fiscal Quarter | Seasonal Factor | vs Trend | Interpretation | Obs. |
|---|---|---|---|---|
| FQ1 (Sep–Nov) | 1.0932 | +9.3% | +9.3% above trend | 2 |
| FQ2 (Dec–Feb) | 0.9924 | -0.8% | In line with trend | 15 |
| FQ3 (Mar–May) | 0.9876 | -1.2% | In line with trend | 15 |
| FQ4 (Jun–Aug) | 1.0221 | +2.2% | In line with trend | 15 |
How Spending Drives Revenue
Want this analysis for your portfolio?
I build custom revenue intelligence reports for investors and companies using SEC filing data, econometric modeling, and AI-powered insights.
Get in Touch