United Rentals, Inc. URI
Revenue Intelligence Report • 62 quarters of SEC filing data • Updated 2026-03-15
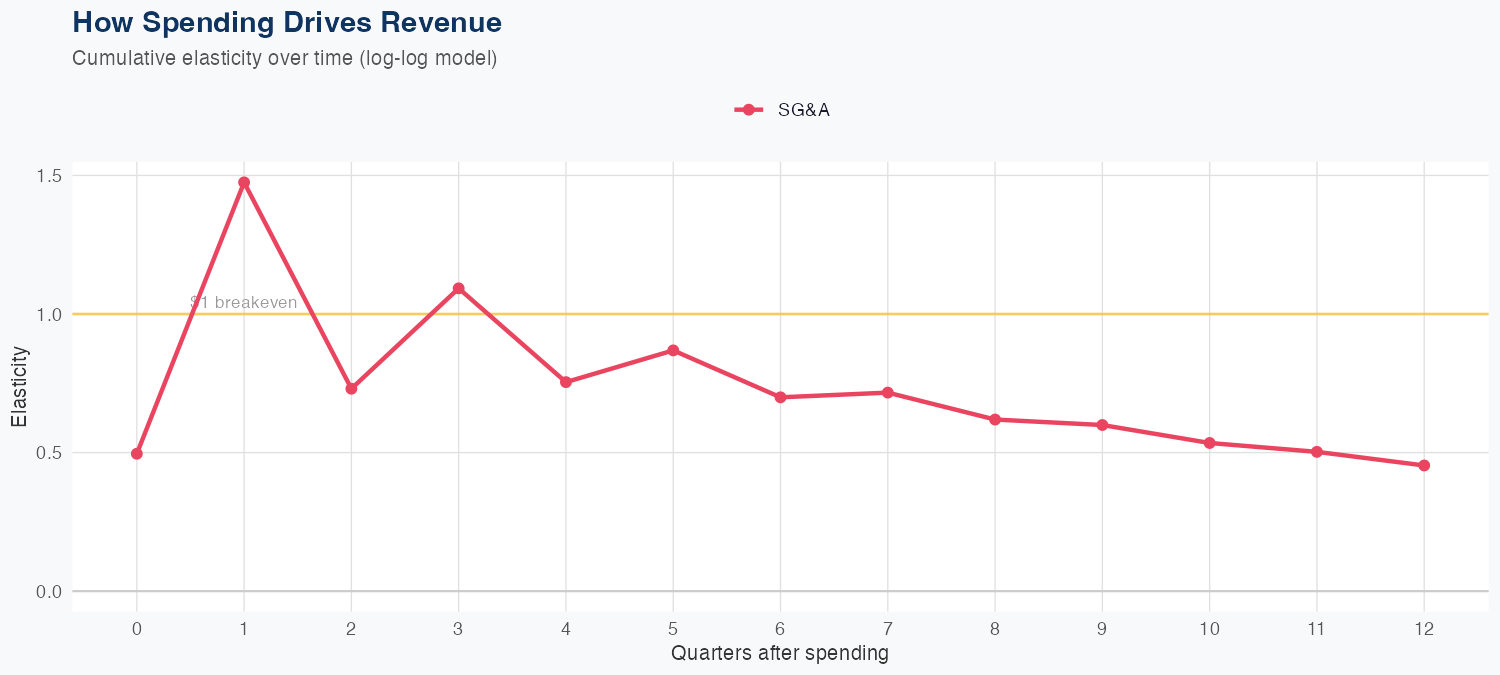
In a log-log framework, revenue is driven by SG&A spending with an elasticity of 1.20: a 1% increase in SG&A predicts a 1.20% uplift in revenue, suggesting SG&A investments are a key growth lever, with model MAPE at 3.3%. Holdout testing shows the model predicted 4.30B versus 4.20B actual, a -2.1% error, indicating credible out-of-sample performance. Latest quarterly revenue is 4.208B, and the full-year forecast of 18B implies about 9.7% year-over-year growth, signaling solid momentum. The implied ROI of SG&A spending appears favorable within this framework, though true profitability depends on margins and other costs, and the lack of R&D data leaves some drivers unquantified; nonetheless the growth trajectory suggests a constructive outlook for investors.
Investment Thesis
The econometric model achieves strong accuracy (3.3% MAPE), suggesting United Rentals, Inc.'s revenue trajectory is well-characterized by its spending patterns. Sales & marketing spend shows a 1.20x elasticity, suggesting effective go-to-market execution.
Revenue Forecast
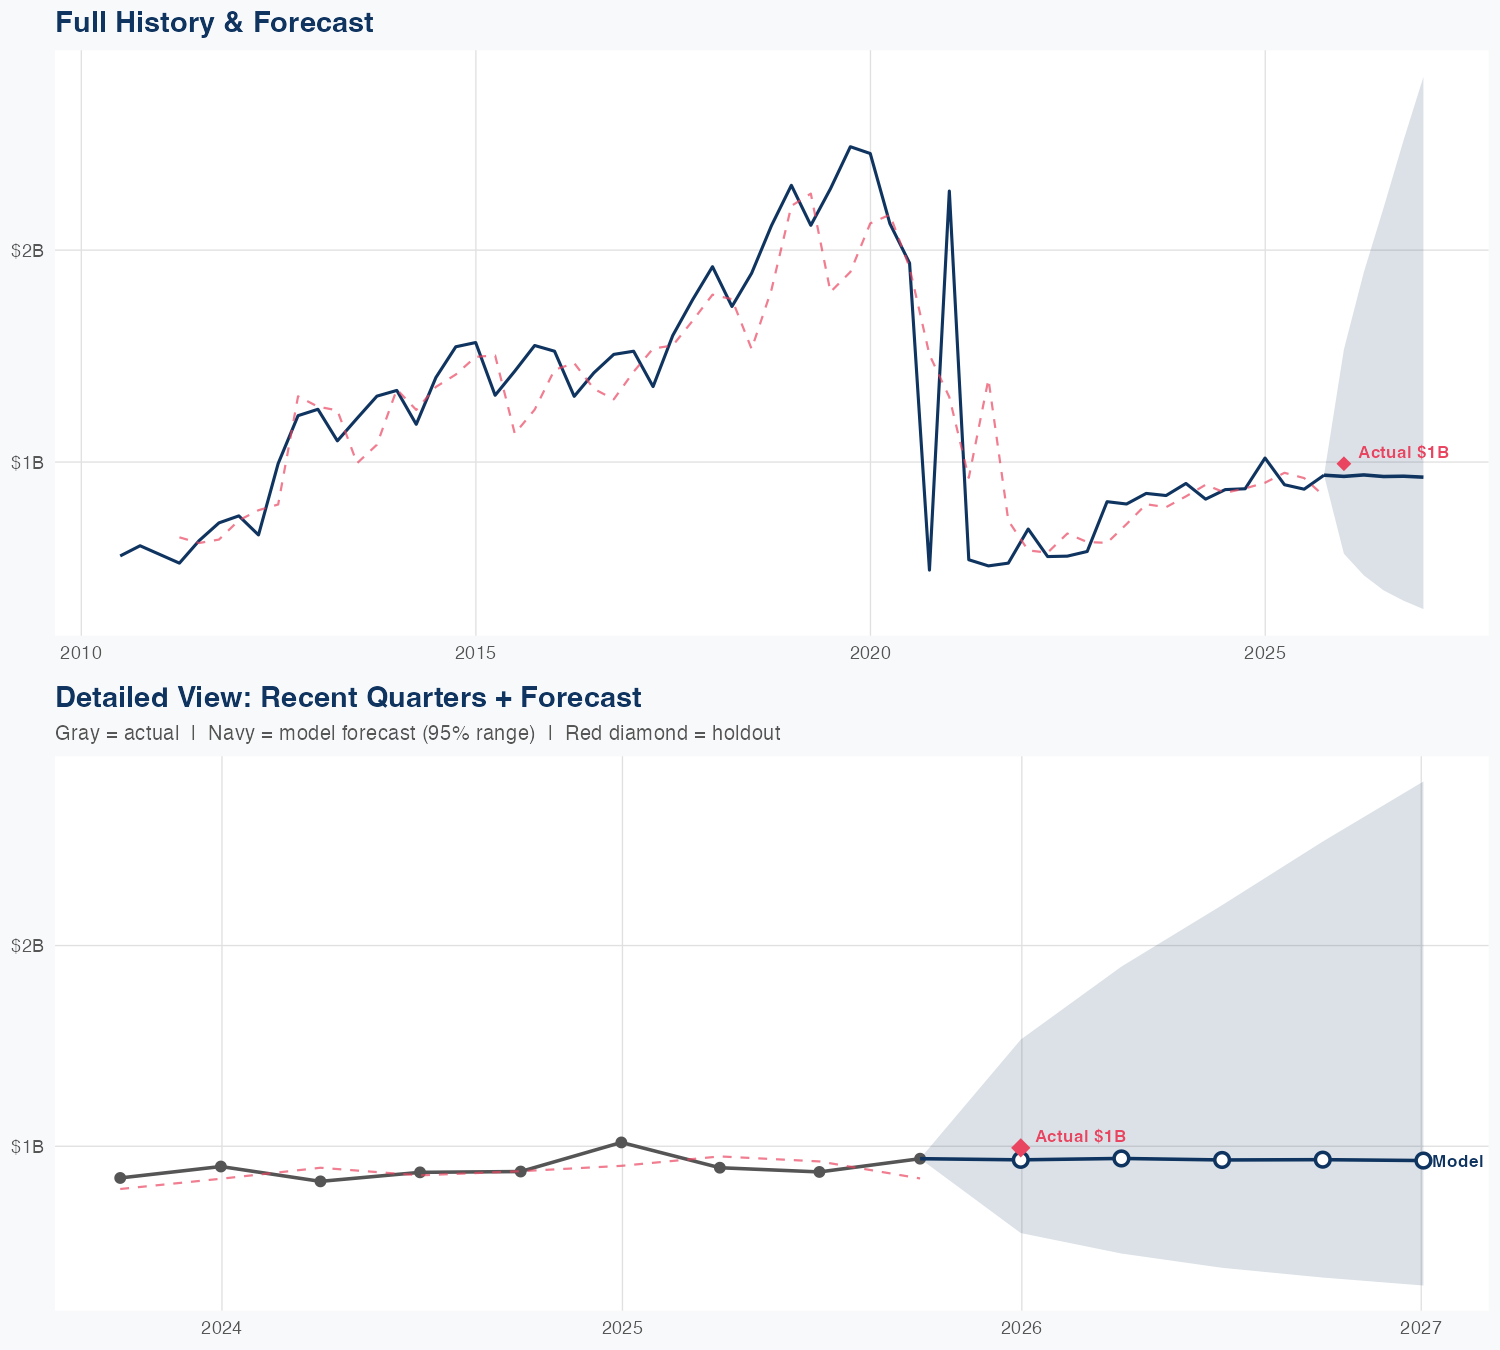
Quarterly Detail
| Quarter | Model Forecast | Actual | 95% Range | YoY Growth | Status |
|---|---|---|---|---|---|
| Q4 2025 | $4.3B | $4.2B | $4.0B – $4.6B | +4.9% | ✓ In range |
| Q2 2026 | $4.2B | $3.7B – $4.7B | +12.1% | ||
| Q3 2026 | $4.3B | $3.8B – $4.9B | +9.2% | ||
| Q4 2026 | $4.5B | $3.9B – $5.3B | +7.4% | ||
| Q1 2027 | $4.6B | $3.9B – $5.5B | +10.4% |
Seasonal Factors
| Fiscal Quarter | Seasonal Factor | vs Trend | Interpretation | Obs. |
|---|---|---|---|---|
| FQ1 (Sep–Nov) | 1.0016 | +0.2% | In line with trend | 15 |
| FQ2 (Dec–Feb) | 1.0118 | +1.2% | In line with trend | 15 |
| FQ3 (Mar–May) | 0.9642 | -3.6% | -3.6% below trend | 14 |
| FQ4 (Jun–Aug) | 1.0207 | +2.1% | In line with trend | 14 |
How Spending Drives Revenue
Want this analysis for your portfolio?
I build custom revenue intelligence reports for investors and companies using SEC filing data, econometric modeling, and AI-powered insights.
Get in Touch