Exxon Mobil Corporation XOM
Revenue Intelligence Report • 36 quarters of SEC filing data • Updated 2026-03-15
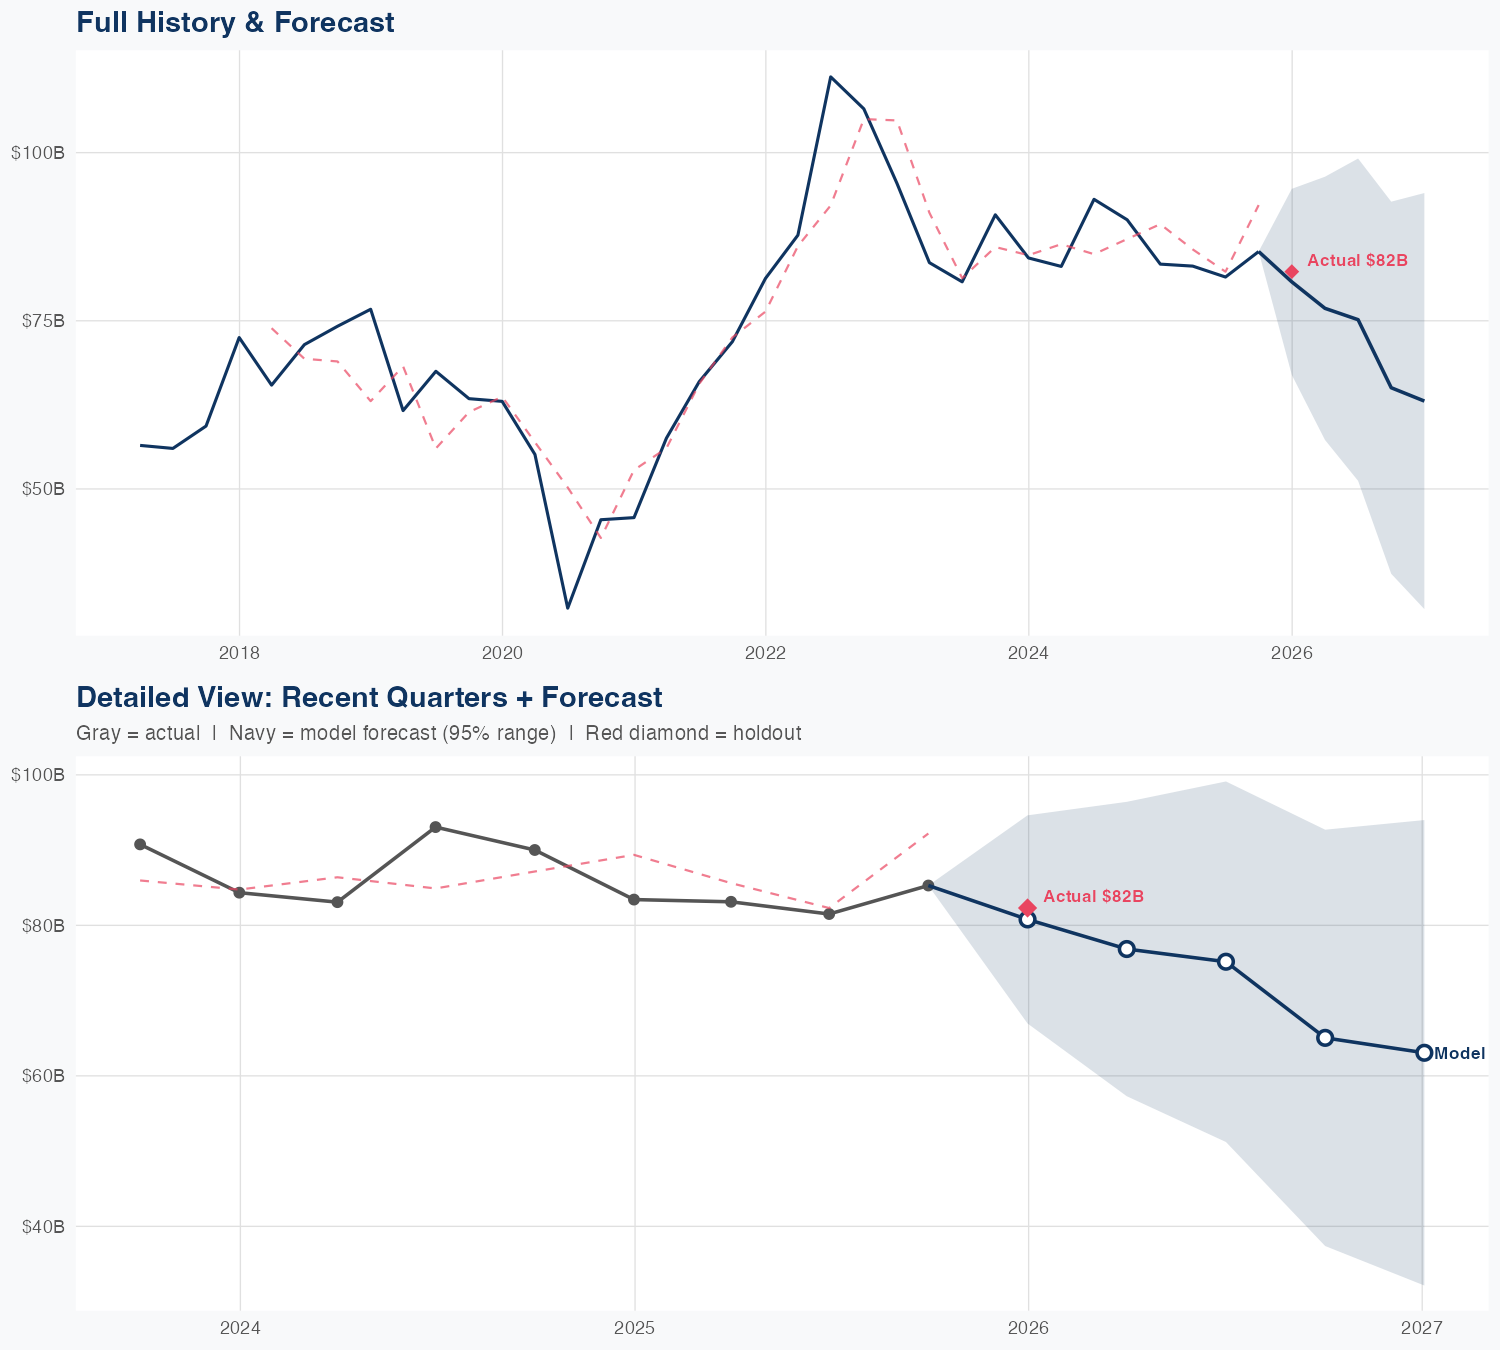
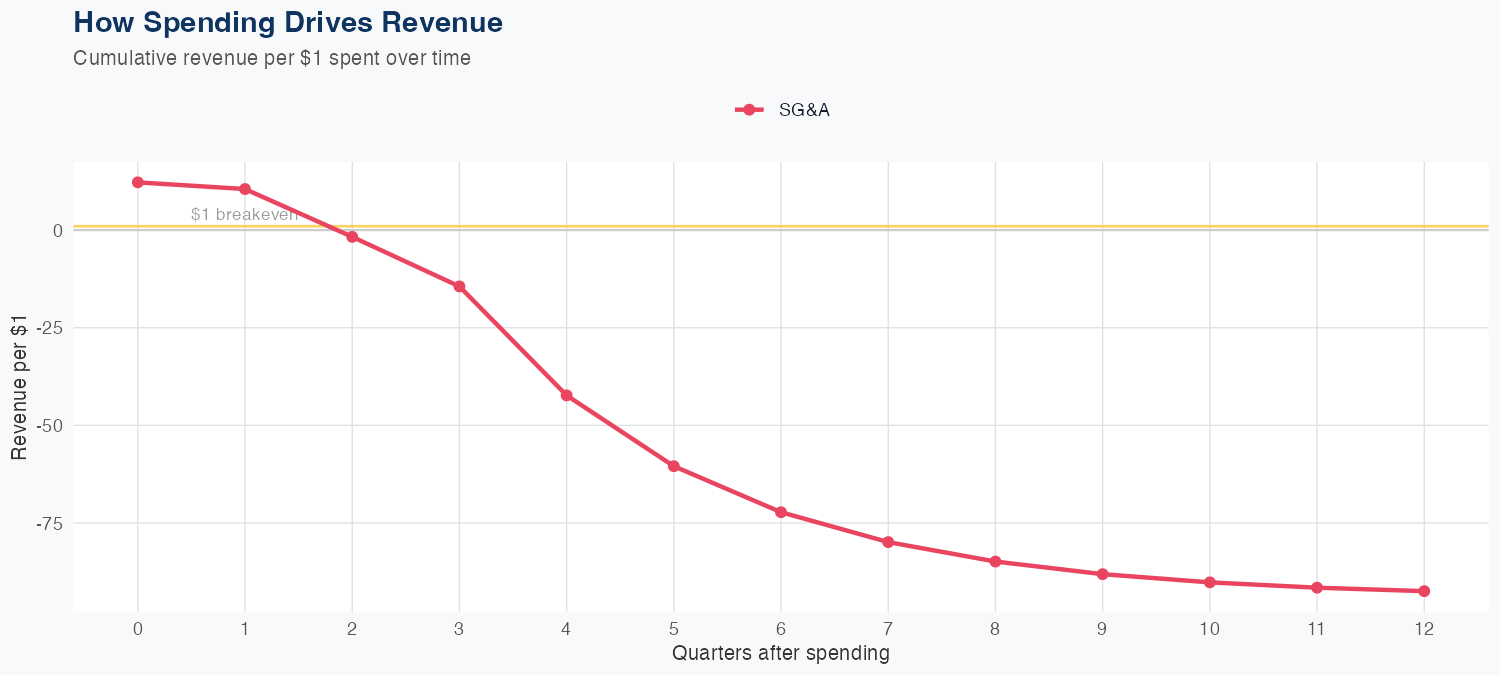
In our econometric model, Exxon’s SG&A elasticity is -3.02x, implying SG&A tends to move opposite to revenue and that incremental growth would come from higher activity (upstream volumes, refining throughput, product mix) rather than cost expansion. The holdout forecast was $82.1B versus actual $82.3B, a -0.2% error, which supports near-term forecast reliability even as overall revenue fell 18.5% YoY; 36 quarters of MAPE at 9.5% remains a reasonable gauge in a volatile energy cycle. With revenue in retreat, growth is likely to hinge on a rebound in commodity prices and volumes rather than SG&A creep, and the negative elasticity signals margin resilience under improving activity. Risks to this growth path include further commodity-price volatility, geopolitical/cyclical shifts, and a capex-intensive upstream cycle that could extend earnings cyclicality if volumes or margins disappoint.
Investment Thesis
At 9.5% MAPE, the model captures Exxon Mobil Corporation's broad revenue trajectory, though quarterly variability suggests sensitivity to external factors.
Revenue Forecast
Quarterly Detail
| Quarter | Model Forecast | Actual | 95% Range | YoY Growth | Status |
|---|---|---|---|---|---|
| Q4 2025 | $82B | $82B | $64B – $105B | -1.5% | ✓ In range |
| Q2 2026 | $71B | $50B – $100B | -15.1% | ||
| Q3 2026 | $69B | $45B – $105B | -15.5% | ||
| Q4 2026 | $67B | $41B – $109B | -21.7% | ||
| Q1 2027 | $64B | $37B – $111B | -21.7% |
Seasonal Factors
| Fiscal Quarter | Seasonal Factor | vs Trend | Interpretation | Obs. |
|---|---|---|---|---|
| FQ1 (Sep–Nov) | 1.0376 | +3.8% | +3.8% above trend | 9 |
| FQ2 (Dec–Feb) | 0.9612 | -3.9% | -3.9% below trend | 9 |
| FQ3 (Mar–May) | 0.9345 | -6.5% | -6.5% below trend | 8 |
| FQ4 (Jun–Aug) | 1.1347 | +13.5% | +13.5% above trend | 8 |
How Spending Drives Revenue
Want this analysis for your portfolio?
I build custom revenue intelligence reports for investors and companies using SEC filing data, econometric modeling, and AI-powered insights.
Get in Touch