Amazon Com Inc AMZN
Revenue Intelligence Report • 70 quarters of SEC filing data • Updated 2026-03-15
Amazon Com Inc has a forecasted full-year revenue of $860B, a +20.0% year-over-year change, based on 70 quarters of SEC filing data. Key revenue drivers include SG&A (elasticity 0.69x). The ARDL model has 5.0% MAPE.
Investment Thesis
The econometric model achieves strong accuracy (5.0% MAPE), suggesting Amazon Com Inc's revenue trajectory is well-characterized by its spending patterns. Sales & marketing spend shows a 0.69x elasticity, suggesting effective go-to-market execution.
Next FY Revenue
$860.0B
+20.0% YoY
SG&A Elasticity
0.69x
Model Accuracy
5.0% MAPE
Holdout validation: The model predicted $205B vs the actual $213B — an error of 4.0%.
Note:
Amazon Com Inc does not report R&D expenses separately. This analysis uses SG&A spending only.
Revenue Forecast
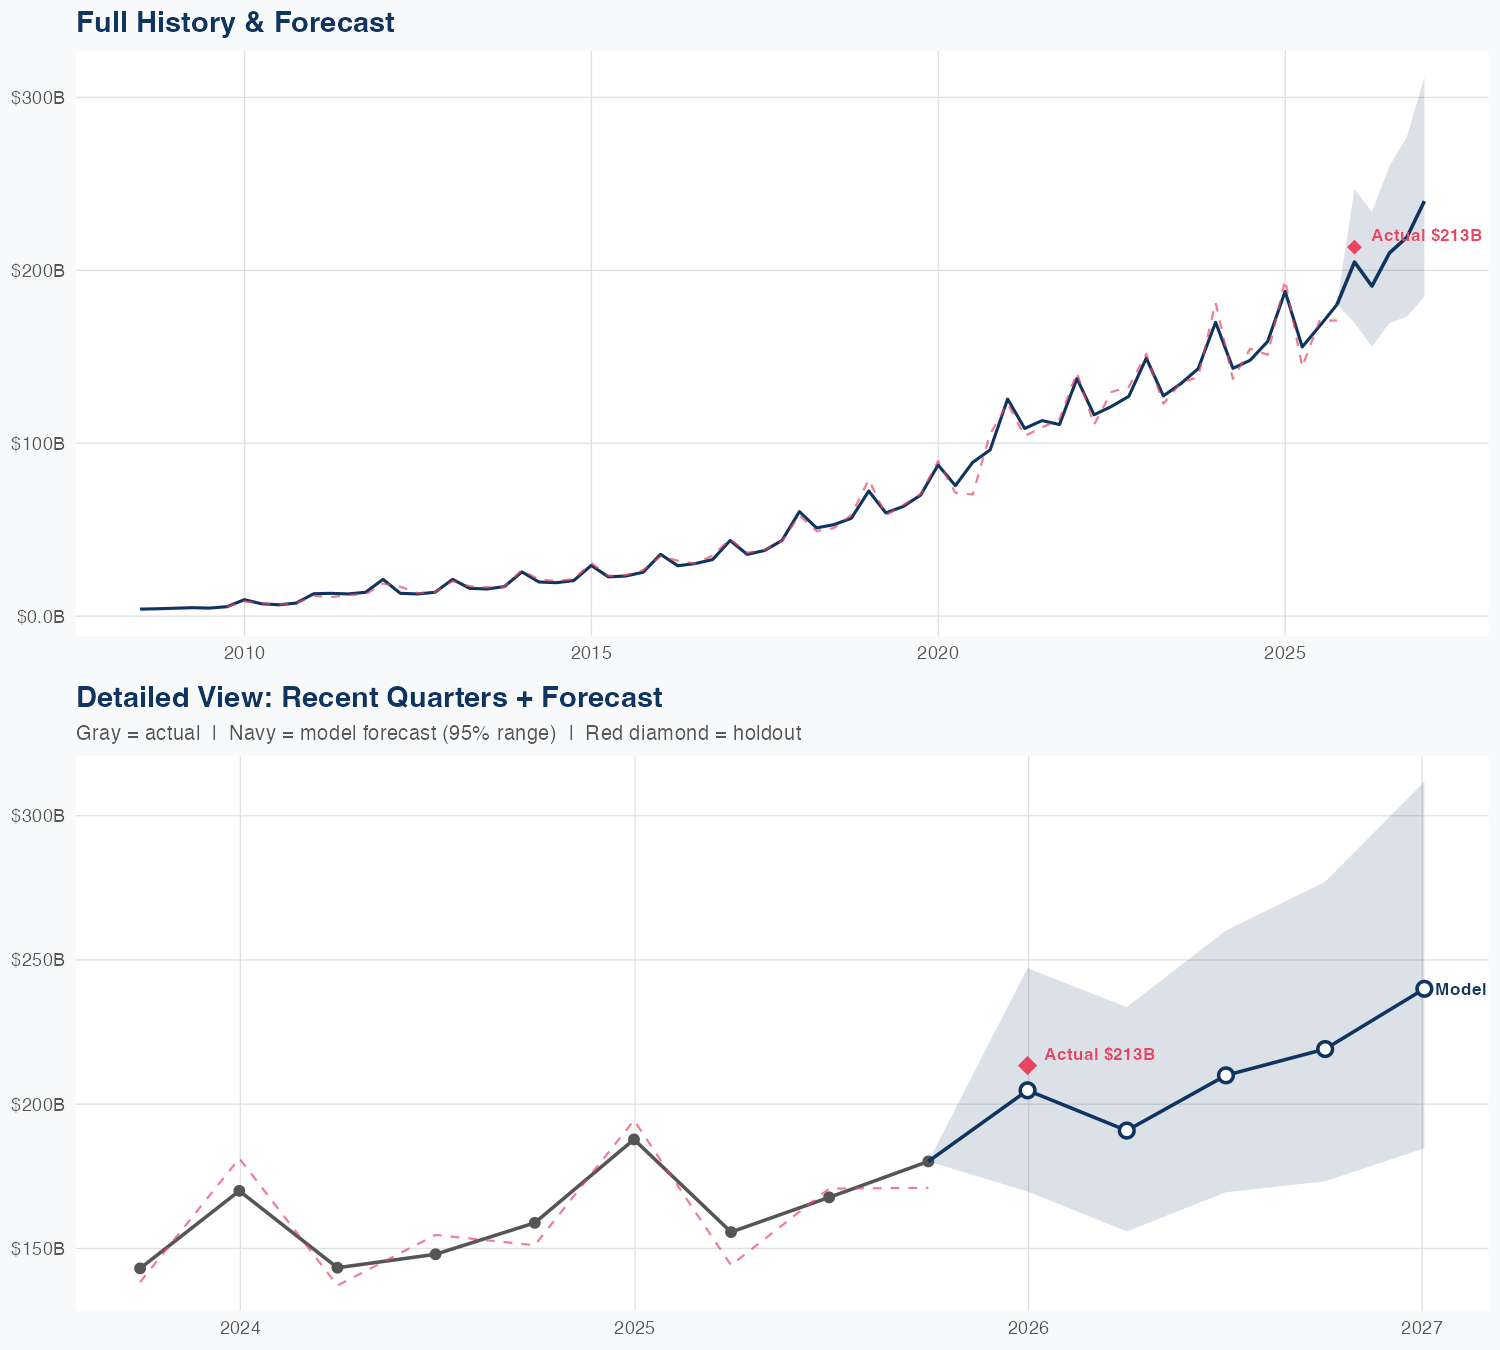
Quarterly Detail
| Quarter | Model Forecast | Actual | 95% Range | YoY Growth | Status |
|---|---|---|---|---|---|
| Q4 2025 | $205B | $213B | $170B – $247B | +9.1% | ✓ In range |
| Q2 2026 | $191B | $156B – $234B | +22.6% | ||
| Q3 2026 | $210B | $169B – $260B | +25.2% | ||
| Q4 2026 | $219B | $173B – $277B | +21.6% | ||
| Q1 2027 | $240B | $185B – $312B | +12.5% |
Seasonal Factors
Multiplicative seasonal adjustment:
These factors capture Amazon Com Inc's systematic quarterly revenue patterns relative to the trend model.
A factor of 1.05 means that quarter typically runs 5% above the underlying trend; 0.95 means 5% below.
Factors are computed as the median of (actual / fitted) across all available quarters.
| Fiscal Quarter | Seasonal Factor | vs Trend | Interpretation | Obs. |
|---|---|---|---|---|
| FQ1 (Sep–Nov) | 0.997 | -0.3% | In line with trend | 17 |
| FQ2 (Dec–Feb) | 0.9835 | -1.6% | In line with trend | 17 |
| FQ3 (Mar–May) | 1.037 | +3.7% | +3.7% above trend | 16 |
| FQ4 (Jun–Aug) | 0.9862 | -1.4% | In line with trend | 16 |
How Spending Drives Revenue
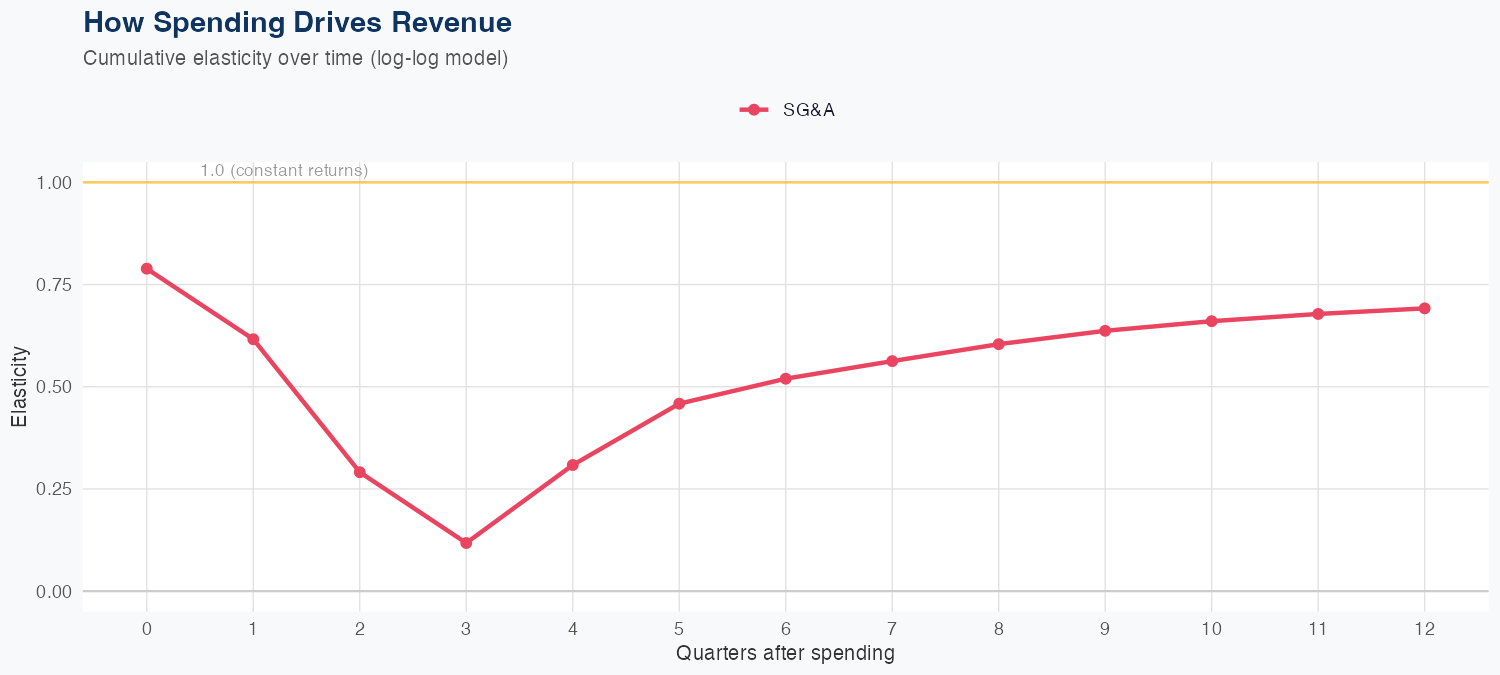
Reading this chart:
Each line shows the cumulative elasticity — how a 1% increase in spending translates to revenue growth over subsequent quarters. The effect builds over 4-5 quarters as investments compound.
Spending Efficiency Over Time
Time-varying analysis:
A penalized spline model (GAM) tracks how the link between spending and revenue has evolved over 70 quarters.
A falling elasticity means the company needs less incremental spending to sustain growth — a hallmark of operating leverage from platform scale, pricing power, or recurring-revenue streams. A rising elasticity means each percent of additional spending more readily drives revenue than before.
Current SG&A elasticity: 0.3997x
Current SG&A elasticity: 0.3997x
Enhanced forecast:
The time-varying model (GAM) outperformed the fixed-coefficient ARDL on holdout validation
(-4.0% error vs ARDL, R² = 0.995),
so this report uses the GAM for its quarterly forecasts.
Want this analysis for your portfolio?
I build custom revenue intelligence reports for investors and companies using SEC filing data, econometric modeling, and AI-powered insights.
Get in Touch