Applovin Corporation APP
Revenue Intelligence Report • 24 quarters of SEC filing data • Updated 2026-03-15
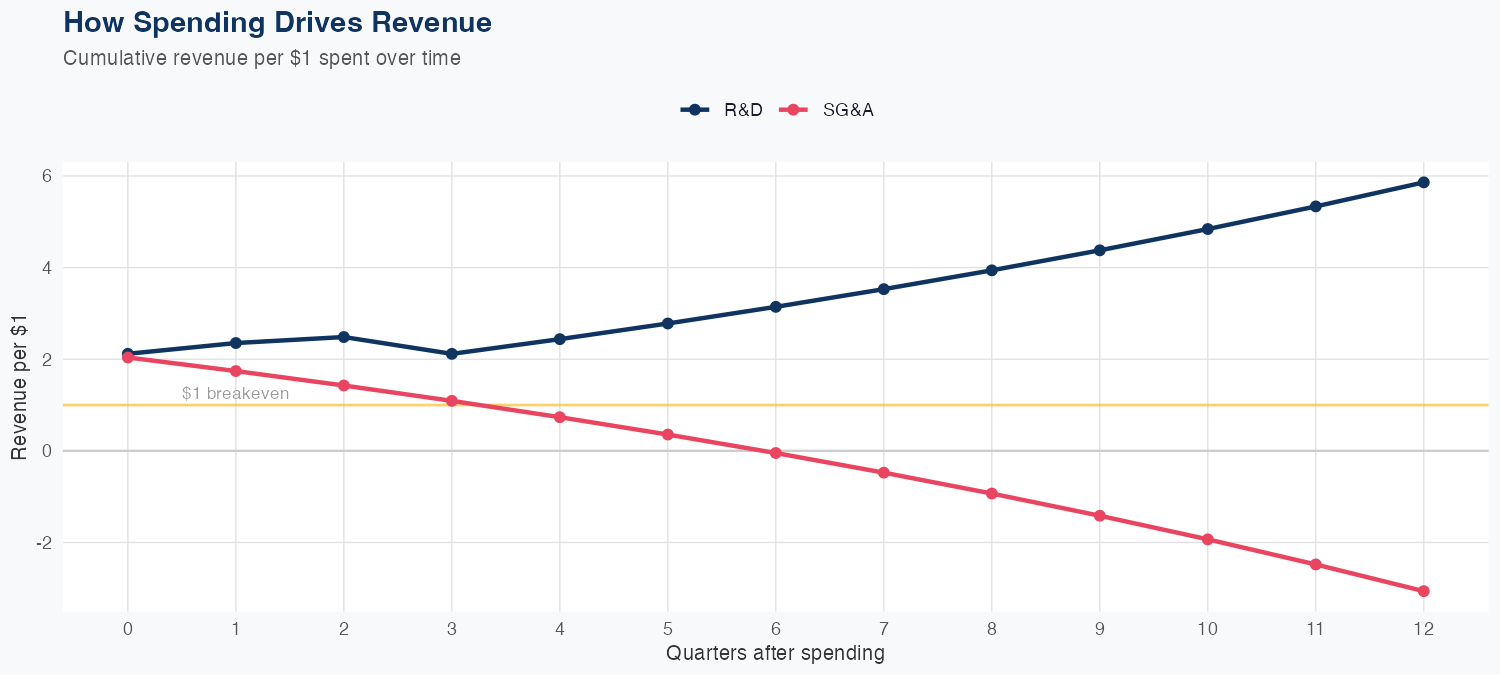
R&D spending drives revenue growth, with the model assuming $1 of R&D yields $5.86 in long-run revenue, while $1 of SG&A reduces long-run revenue by $3.06. The model is linear, estimated on 24 quarters of data, and reports a 6.5% MAPE indicating moderate accuracy. In holdout testing, the model predicted about $1.8B versus actual $1.3B, a 33.9% miss that highlights some risk in near-term forecasts. The FY revenue forecast is $9.0B, up 64.5% year over year, signaling a strong growth outlook but investors should weigh the model risk and SG&A drag when sizing upside.
Investment Thesis
The econometric model achieves strong accuracy (6.5% MAPE), suggesting Applovin Corporation's revenue trajectory is well-characterized by its spending patterns. Every $1 of R&D investment is associated with $5.86 of revenue, indicating efficient capital deployment in innovation.
Revenue Forecast
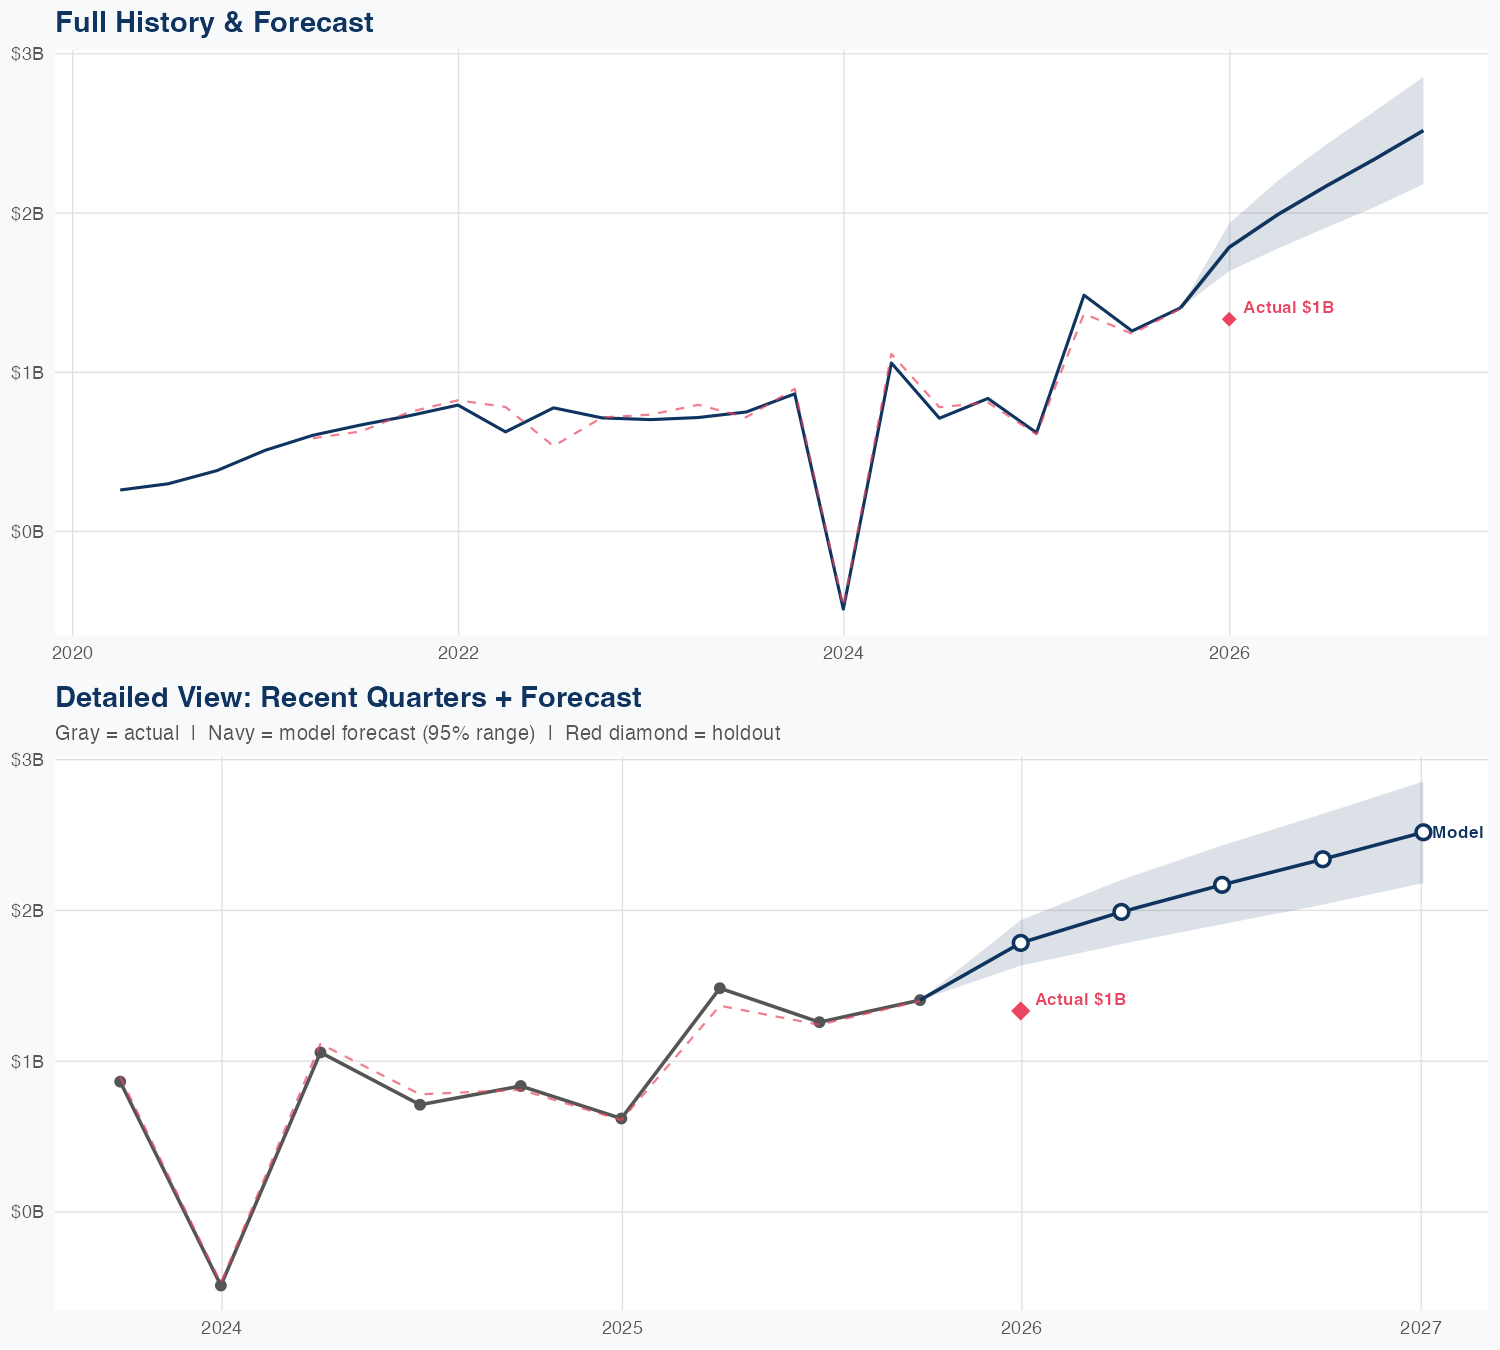
Quarterly Detail
| Quarter | Model Forecast | Actual | 95% Range | YoY Growth | Status |
|---|---|---|---|---|---|
| Q4 2025 | $1.8B | $1.3B | $1.6B – $1.9B | +187.9% | ✗ Outside range |
| Q2 2026 | $2.0B | $1.8B – $2.2B | +34.1% | ||
| Q3 2026 | $2.2B | $1.9B – $2.4B | +72.4% | ||
| Q4 2026 | $2.3B | $2.0B – $2.6B | +66.5% | ||
| Q1 2027 | $2.5B | $2.2B – $2.9B | +88.9% |
Seasonal Factors
| Fiscal Quarter | Seasonal Factor | vs Trend | Interpretation | Obs. |
|---|---|---|---|---|
| FQ1 (Sep–Nov) | 0.9957 | -0.4% | In line with trend | 5 |
| FQ2 (Dec–Feb) | 0.992 | -0.8% | In line with trend | 4 |
| FQ3 (Mar–May) | 0.949 | -5.1% | -5.1% below trend | 5 |
| FQ4 (Jun–Aug) | 1.0457 | +4.6% | +4.6% above trend | 5 |
How Spending Drives Revenue
Want this analysis for your portfolio?
I build custom revenue intelligence reports for investors and companies using SEC filing data, econometric modeling, and AI-powered insights.
Get in Touch