Broadcom Inc. AVGO
Revenue Intelligence Report • 27 quarters of SEC filing data • Updated 2026-03-15
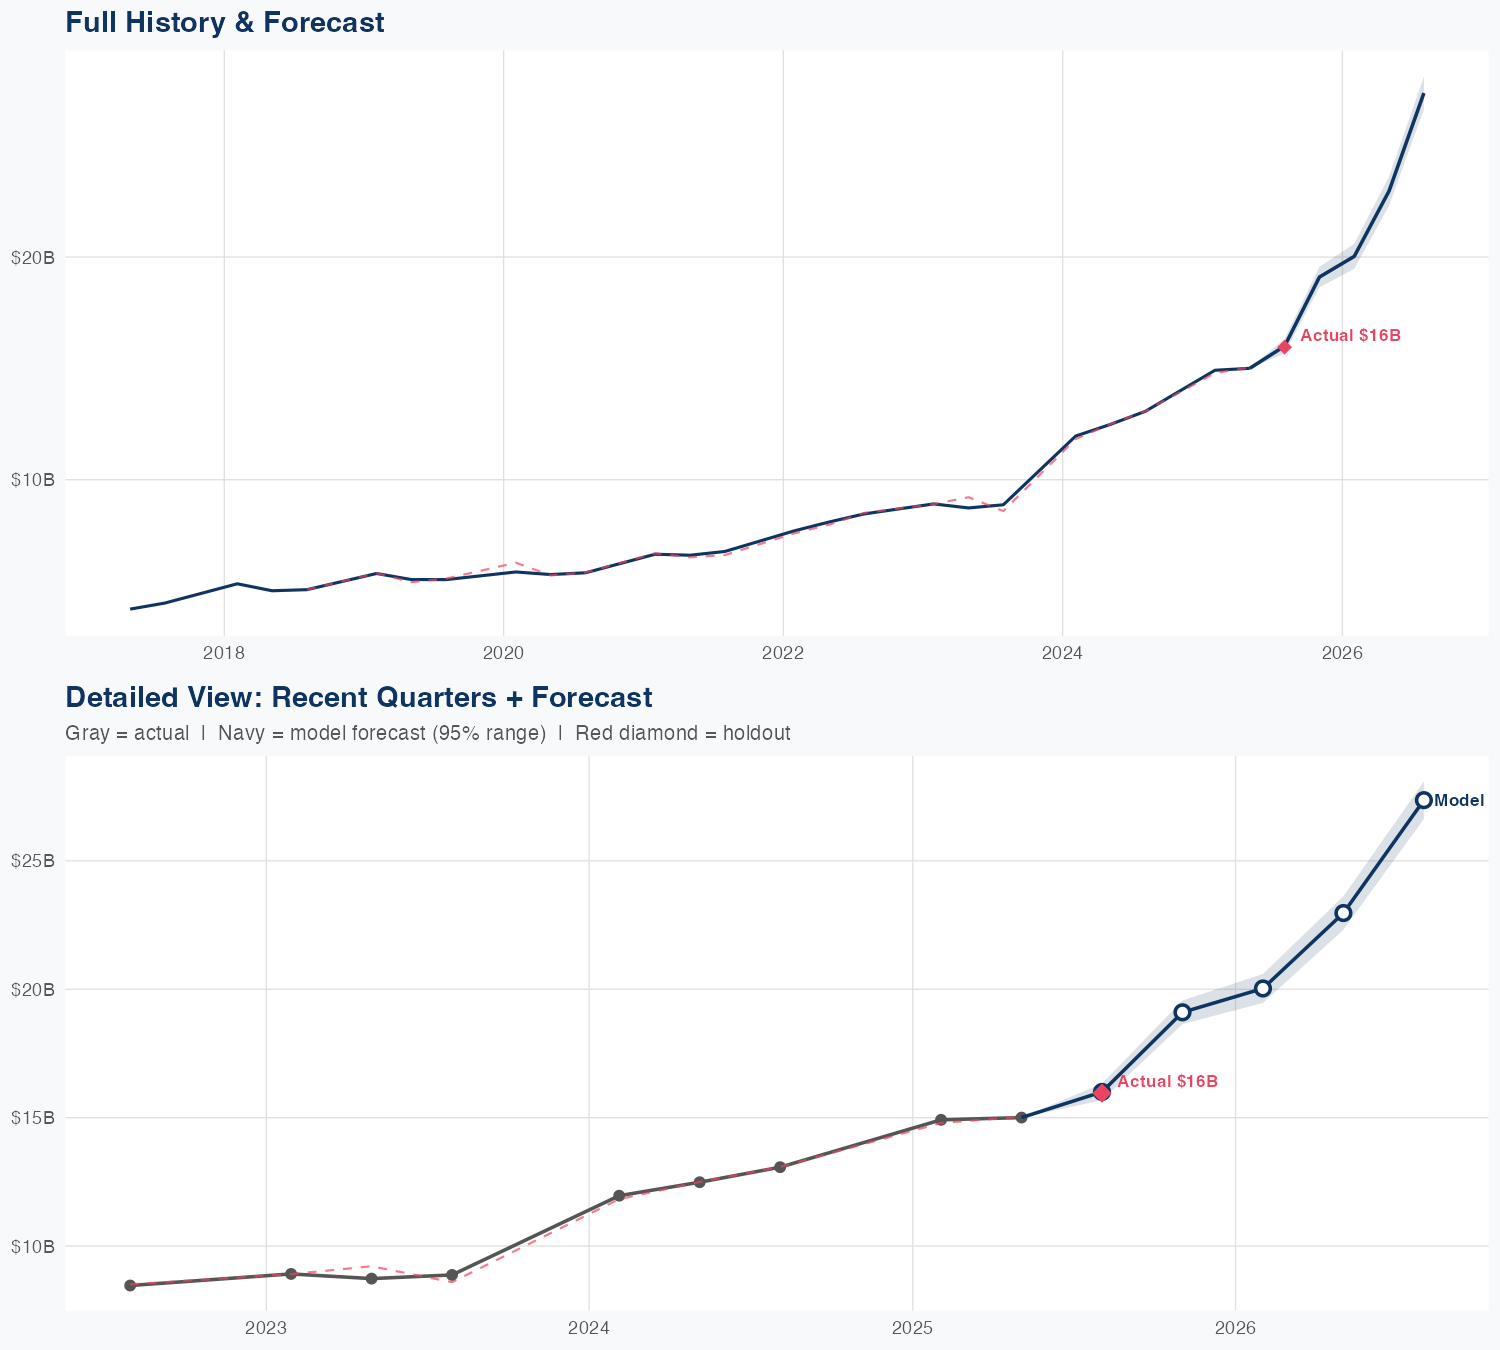
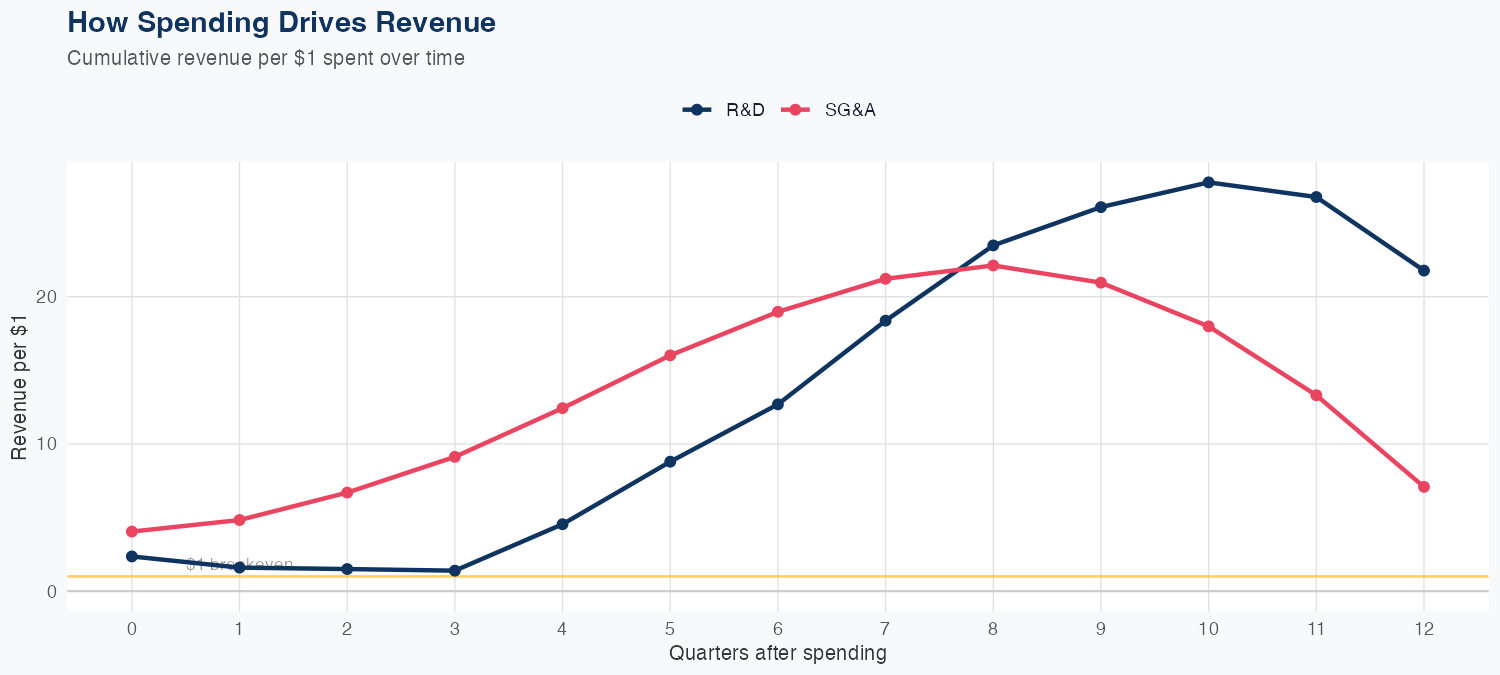
In our econometric model, Broadcom’s revenue responds strongly to both R&D and SG&A spend, with coefficients of about $15.73 of revenue per $1 of R&D and $10.58 per $1 of SG&A. That implies the growth engine is heavily tied to product-cycle innovation and go-to-market monetization, with R&D delivering the most potent uplift—consistent with a portfolio of next-gen chips and VMware software monetization rather than mere price or base revenue effects. The holdout error of 2.8% (predicted $19.8B vs. actual $19.3B) suggests the forecast is reasonably reliable but still subject to quarter-to-quarter noise, likely from integration timing and cyclical capex moves. The 67.6% YoY growth is a large lift that may be unsustainable if hyperscaler demand, VMware contributions, or supply conditions roll over, exposing Broadcom to a sharper slowdown in data-center capex and potential mix-driven margin pressure if software gains accelerate or hardware cycles soften.
Investment Thesis
Our ARDL model tracks Broadcom Inc.'s revenue with exceptional precision (1.6% MAPE), indicating highly predictable cash flows. Every $1 of R&D investment is associated with $15.73 of revenue, indicating efficient capital deployment in innovation. Each $1 of SG&A spending generates $10.58 in revenue, reflecting strong commercial efficiency.
Revenue Forecast
Quarterly Detail
| Quarter | Model Forecast | Actual | 95% Range | YoY Growth | Status |
|---|---|---|---|---|---|
| Q4 2025 | $20B | $19B | $19B – $20B | +51.8% | ✗ Outside range |
| Q1 2026 | $22B | $21B – $22B | +46.4% | ||
| Q2 2026 | $24B | $23B – $24B | +58.1% | ||
| Q3 2026 | $30B | $29B – $31B | +87.5% | ||
| Q4 2026 | $34B | $33B – $35B | +74.8% |
Seasonal Factors
| Fiscal Quarter | Seasonal Factor | vs Trend | Interpretation | Obs. |
|---|---|---|---|---|
| FQ1 (Sep–Nov) | 1.0 | +0.0% | In line with trend | 0 |
| FQ2 (Dec–Feb) | 0.9972 | -0.3% | In line with trend | 8 |
| FQ3 (Mar–May) | 1.0023 | +0.2% | In line with trend | 7 |
| FQ4 (Jun–Aug) | 1.0292 | +2.9% | In line with trend | 8 |
How Spending Drives Revenue
Want this analysis for your portfolio?
I build custom revenue intelligence reports for investors and companies using SEC filing data, econometric modeling, and AI-powered insights.
Get in Touch