Autozone, Inc. AZO
Revenue Intelligence Report • 30 quarters of SEC filing data • Updated 2026-03-15
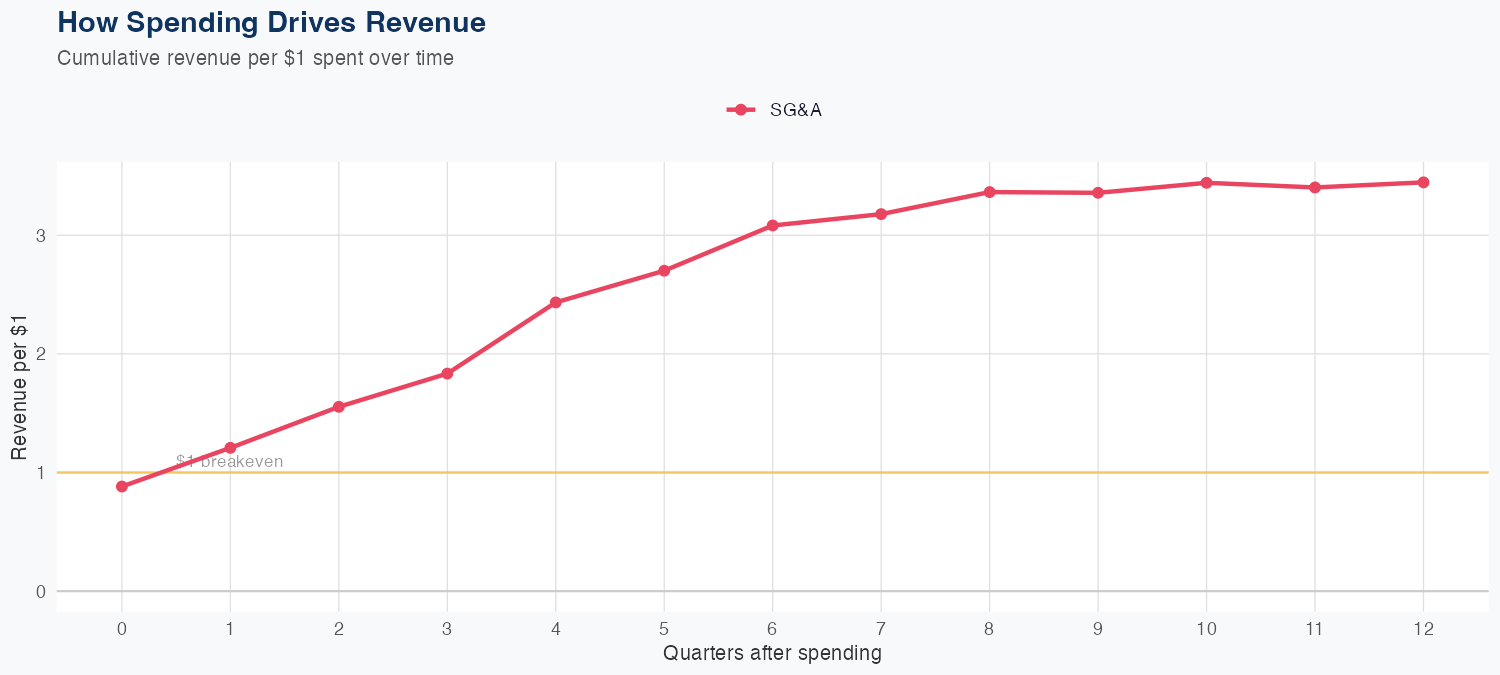
Revenue is driven by a high ROI on SG&A spending, with $1 of SG&A generating $3.45 of long-run revenue, indicating strong leverage from selling and distribution activities. The model, trained on 30 quarters of data, achieves 3.5% MAPE and passes a holdout test where a $4.6B forecast aligns with the actual $4.6B within 1.7%. The FY outlook points to about $20B in revenue, up 12.3% year over year, signaling continued momentum and the sustainability of the SG&A-driven growth dynamic. Investors should focus on the ROI of SG&A investments as the key revenue engine, while noting that R&D data is not available in this framework.
Investment Thesis
The econometric model achieves strong accuracy (3.5% MAPE), suggesting Autozone, Inc.'s revenue trajectory is well-characterized by its spending patterns. Each $1 of SG&A spending generates $3.45 in revenue, reflecting strong commercial efficiency.
Revenue Forecast
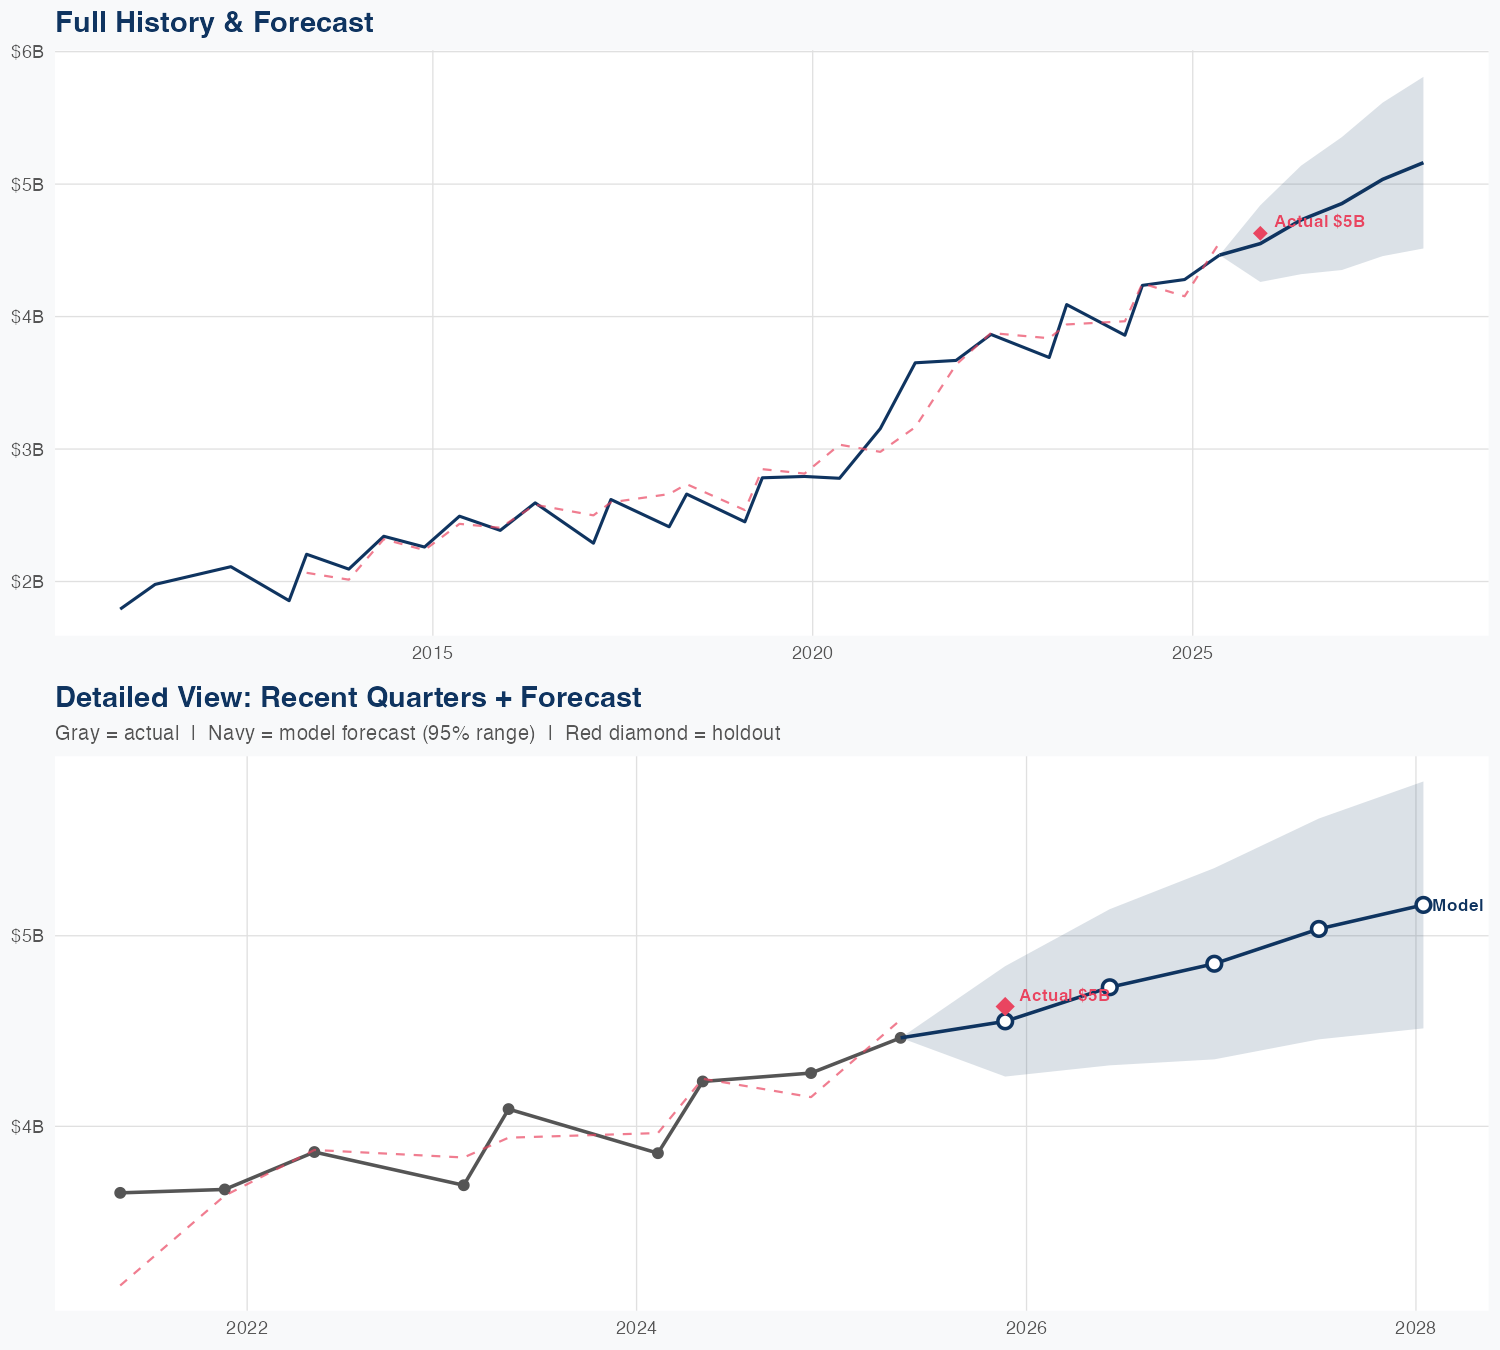
Quarterly Detail
| Quarter | Model Forecast | Actual | 95% Range | YoY Growth | Status |
|---|---|---|---|---|---|
| Q4 2025 | $4.6B | $4.6B | $4.3B – $4.8B | +17.9% | ✓ In range |
| Q2 2026 | $4.7B | $4.3B – $5.1B | +11.7% | ||
| Q4 2026 | $4.9B | $4.4B – $5.4B | +13.4% | ||
| Q3 2027 | $5.0B | $4.5B – $5.6B | +12.8% | ||
| Q1 2028 | $5.2B | $4.5B – $5.8B | +11.5% |
Seasonal Factors
| Fiscal Quarter | Seasonal Factor | vs Trend | Interpretation | Obs. |
|---|---|---|---|---|
| FQ1 (Sep–Nov) | 1.0103 | +1.0% | In line with trend | 8 |
| FQ2 (Dec–Feb) | 0.9621 | -3.8% | -3.8% below trend | 5 |
| FQ3 (Mar–May) | 1.0055 | +0.6% | In line with trend | 13 |
| FQ4 (Jun–Aug) | 1.0 | +0.0% | In line with trend | 0 |
How Spending Drives Revenue
Want this analysis for your portfolio?
I build custom revenue intelligence reports for investors and companies using SEC filing data, econometric modeling, and AI-powered insights.
Get in Touch