Carnival Corporation CCL
Revenue Intelligence Report • 48 quarters of SEC filing data • Updated 2026-03-15
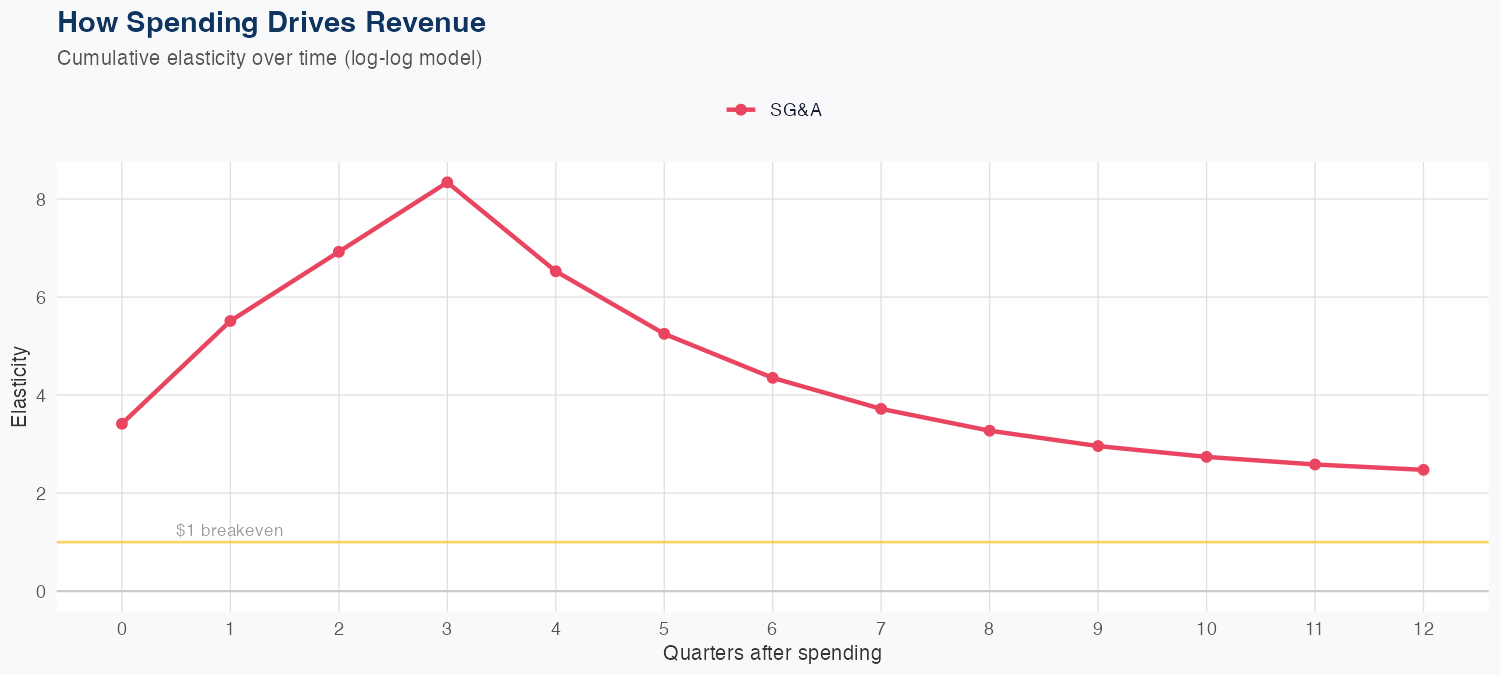
Revenue appears most responsive to SG&A spending, with a 1% increase in SG&A associated with a 2.47% rise in revenue, indicating a positive elasticity and potential ROI from marketing and commercial activity. The model is a log-log specification with 31.4% MAPE, and a holdout test predicted 5.0B versus actual 6.3B (about 20.9% error), signaling limited predictive reliability and notable forecast uncertainty. The FY revenue forecast sits at about $16B, a 40.9% year-over-year decline, underscoring a material near-term slowdown despite SG&A-driven revenue responsiveness. Investors should weigh the positive revenue elasticity against the sizable forecast downside and model uncertainty, focusing on cost discipline and the durability of marketing ROI as conditions evolve.
Investment Thesis
At 31.4% MAPE, the model captures Carnival Corporation's broad revenue trajectory, though quarterly variability suggests sensitivity to external factors. Sales & marketing spend shows a 2.47x elasticity, suggesting effective go-to-market execution.
Revenue Forecast
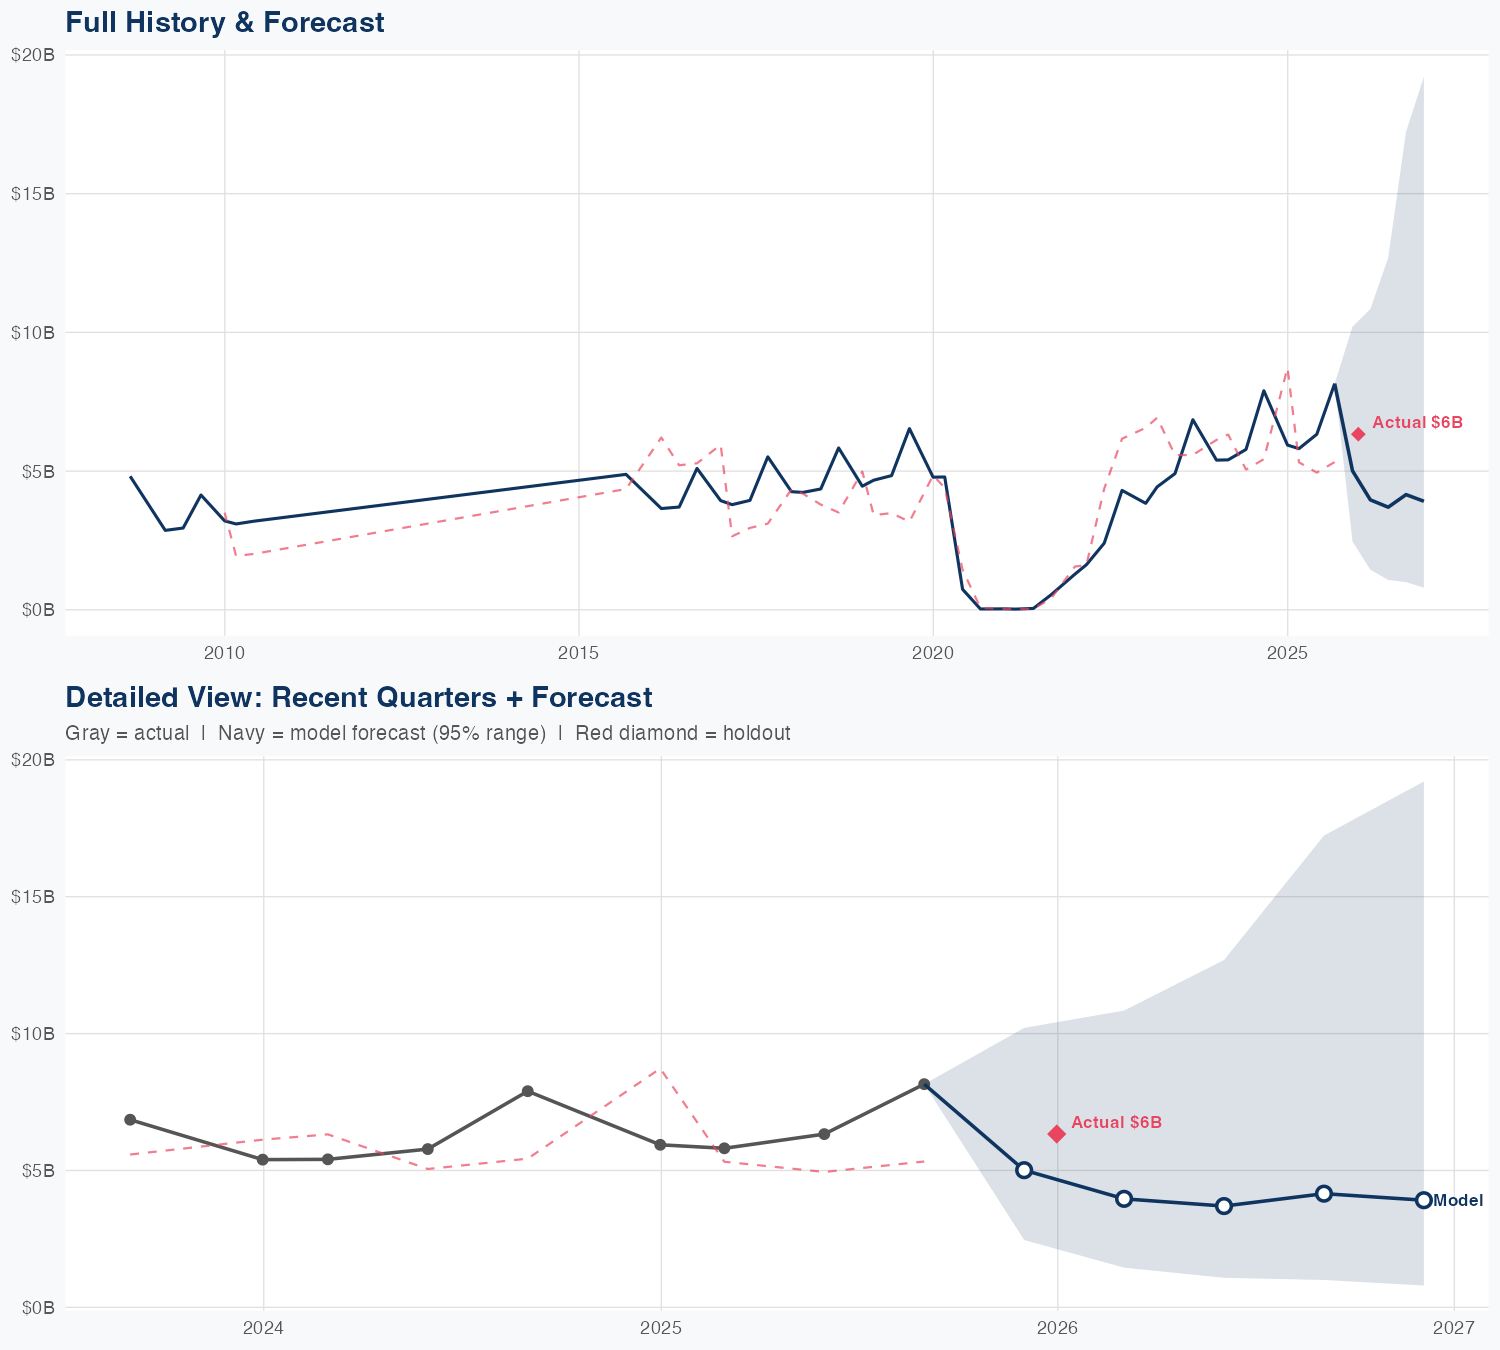
Quarterly Detail
| Quarter | Model Forecast | Actual | 95% Range | YoY Growth | Status |
|---|---|---|---|---|---|
| Q4 2025 | $5.0B | $6.3B | $2.5B – $10B | -15.6% | ✓ In range |
| Q1 2026 | $4.0B | $1.4B – $11B | -31.8% | ||
| Q2 2026 | $3.7B | $1.1B – $13B | -41.5% | ||
| Q3 2026 | $4.2B | $1.0B – $17B | -49.1% | ||
| Q4 2026 | $3.9B | $0.8B – $19B | -38.2% |
Seasonal Factors
| Fiscal Quarter | Seasonal Factor | vs Trend | Interpretation | Obs. |
|---|---|---|---|---|
| FQ1 (Sep–Nov) | 1.0 | +0.0% | In line with trend | 0 |
| FQ2 (Dec–Feb) | 0.9151 | -8.5% | -8.5% below trend | 22 |
| FQ3 (Mar–May) | 1.1482 | +14.8% | +14.8% above trend | 11 |
| FQ4 (Jun–Aug) | 1.3162 | +31.6% | +31.6% above trend | 11 |
How Spending Drives Revenue
Want this analysis for your portfolio?
I build custom revenue intelligence reports for investors and companies using SEC filing data, econometric modeling, and AI-powered insights.
Get in Touch