Costco Wholesale Corp /New COST
Revenue Intelligence Report • 48 quarters of SEC filing data • Updated 2026-03-15
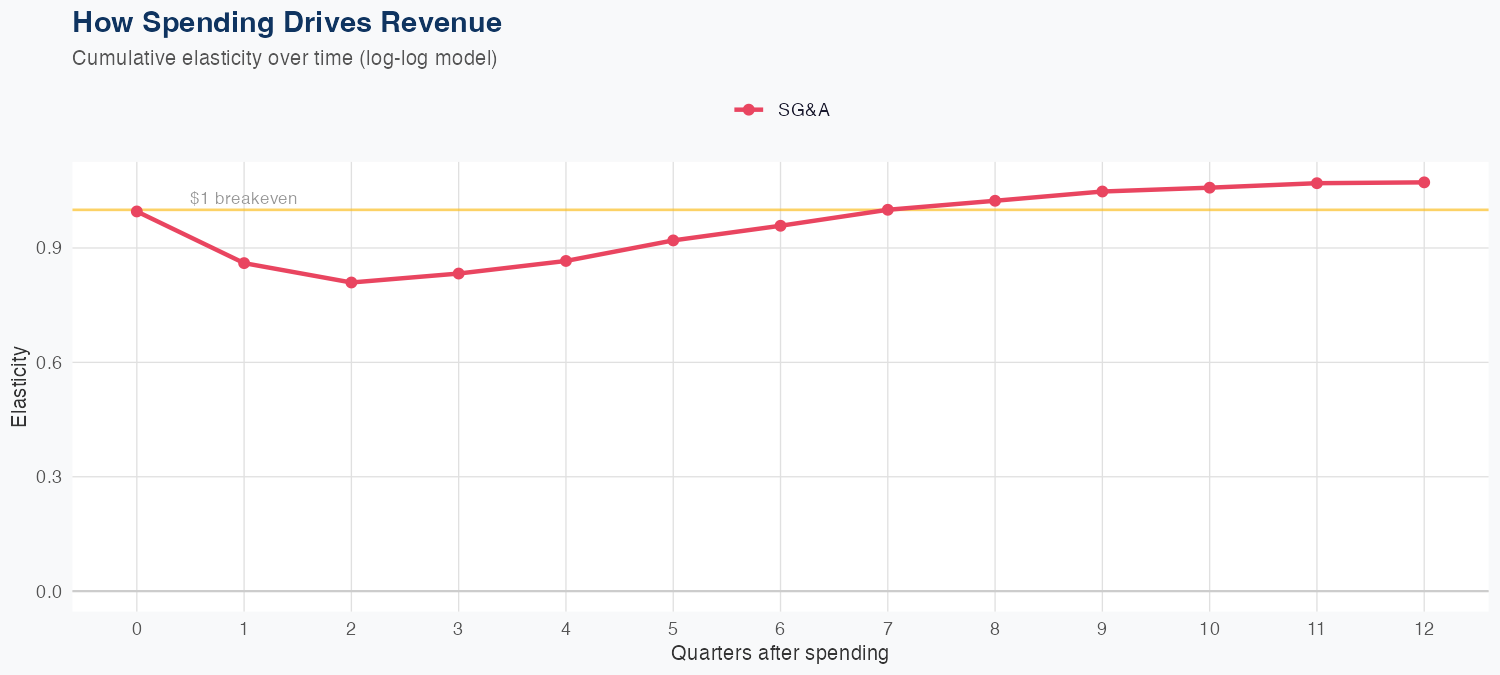
In our econometric model, Costco's FY revenue grew 18.7%, but SG&A elasticity at 1.08x implies cost growth outpaces revenue as the business scales. That means roughly 1% more revenue associates with about 1.08% higher SG&A, so the top-line gain could push SG&A up near 20% year over year, potentially compressing operating margins unless gross margin or membership-driven revenue offsets it. Our econometric model's holdout error of 2.2% (71.1B predicted vs 69.6B actual) with a 1.6% MAPE over 48 quarters signals solid forecast reliability but reveals cost-structure sensitivity to near-term dynamics. Risks to the growth path include wage-driven SG&A pressures, international expansion economics, and inflationary shocks that could erode incremental margins.
Investment Thesis
Our ARDL model tracks Costco Wholesale Corp /New's revenue with exceptional precision (1.6% MAPE), indicating highly predictable cash flows. Sales & marketing spend shows a 1.08x elasticity, suggesting effective go-to-market execution.
Revenue Forecast
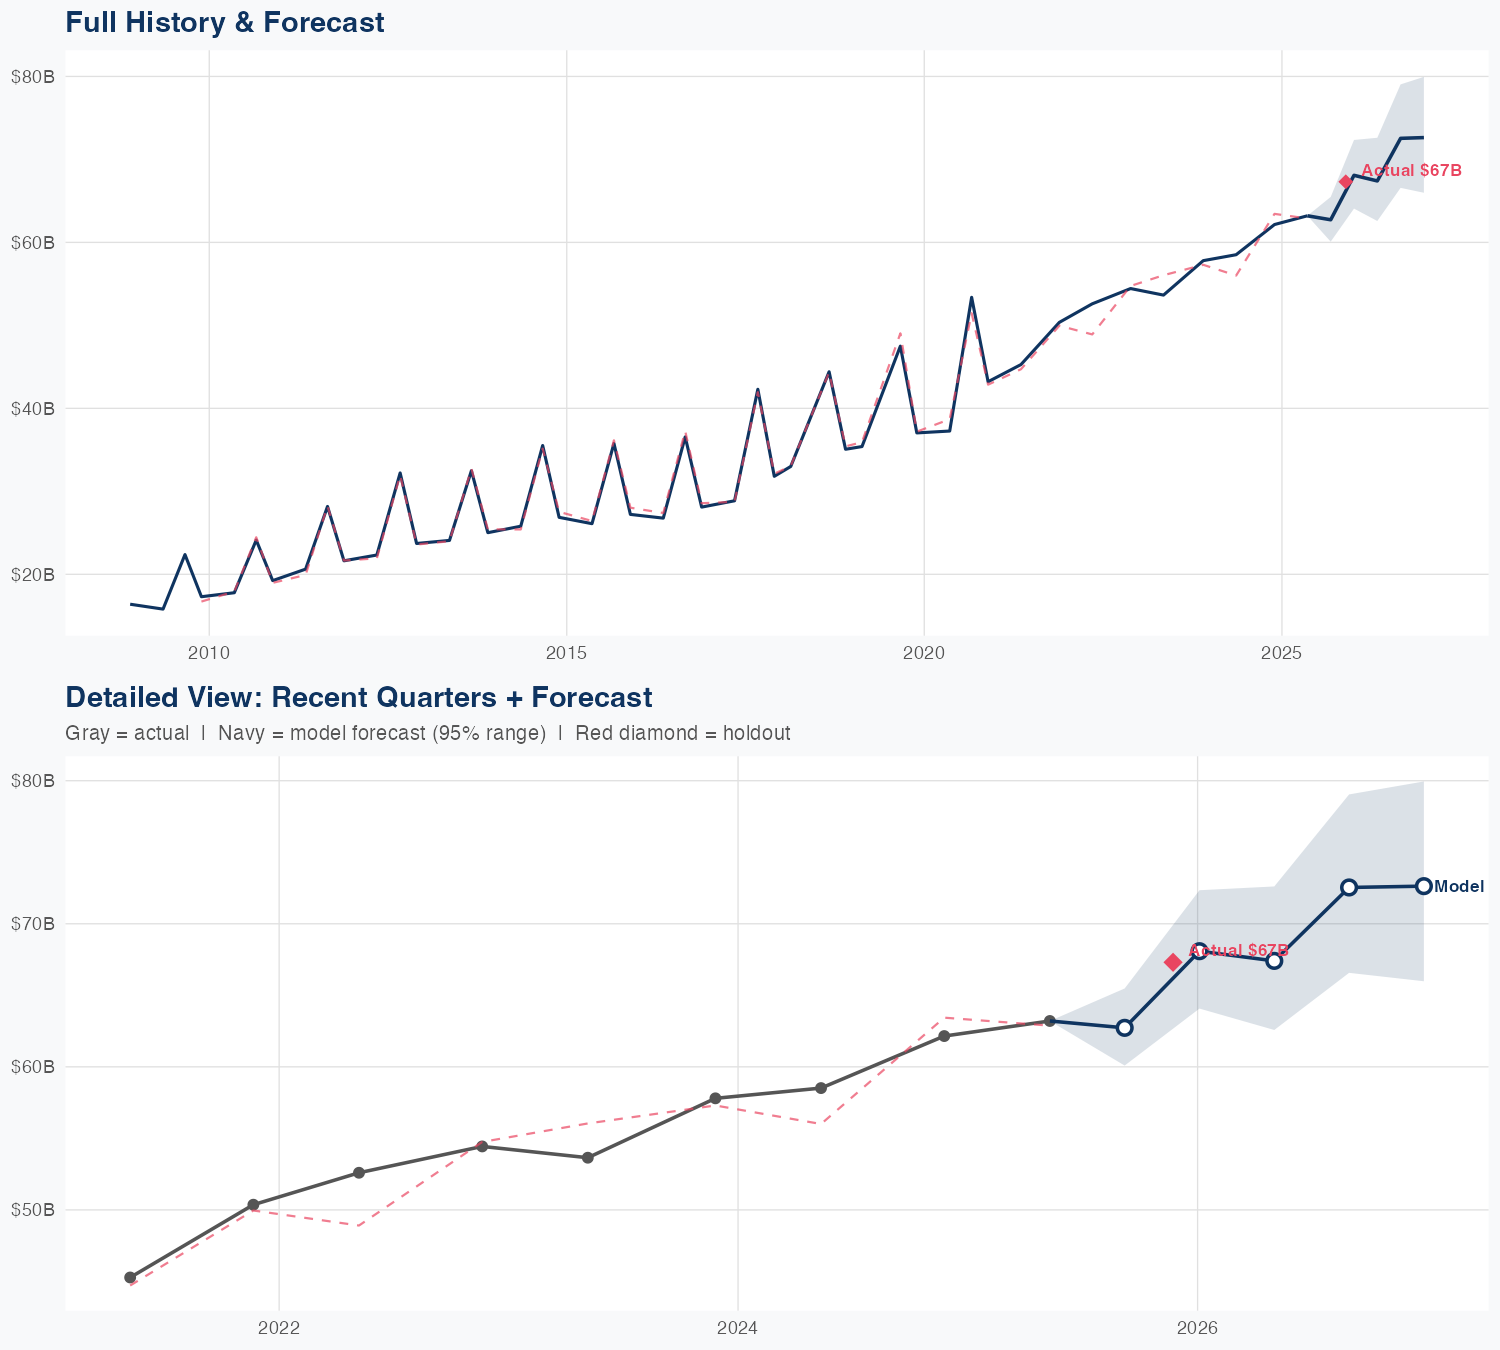
Quarterly Detail
| Quarter | Model Forecast | Actual | 95% Range | YoY Growth | Status |
|---|---|---|---|---|---|
| Q1 2026 | $71B | $70B | $68B – $74B | +21.6% | ✓ In range |
| Q3 2026 | $71B | $67B – $76B | +14.8% | ||
| Q4 2026 | $77B | $72B – $83B | +22.3% | ||
| Q1 2027 | $78B | $72B – $85B | +16.4% | ||
| Q3 2027 | $84B | $77B – $93B | +21.3% |
Seasonal Factors
| Fiscal Quarter | Seasonal Factor | vs Trend | Interpretation | Obs. |
|---|---|---|---|---|
| FQ1 (Sep–Nov) | 0.9986 | -0.1% | In line with trend | 22 |
| FQ2 (Dec–Feb) | 0.9983 | -0.2% | In line with trend | 3 |
| FQ3 (Mar–May) | 1.0042 | +0.4% | In line with trend | 14 |
| FQ4 (Jun–Aug) | 0.9984 | -0.2% | In line with trend | 6 |
How Spending Drives Revenue
Want this analysis for your portfolio?
I build custom revenue intelligence reports for investors and companies using SEC filing data, econometric modeling, and AI-powered insights.
Get in Touch