Deere & Co DE
Revenue Intelligence Report • 53 quarters of SEC filing data • Updated 2026-03-15
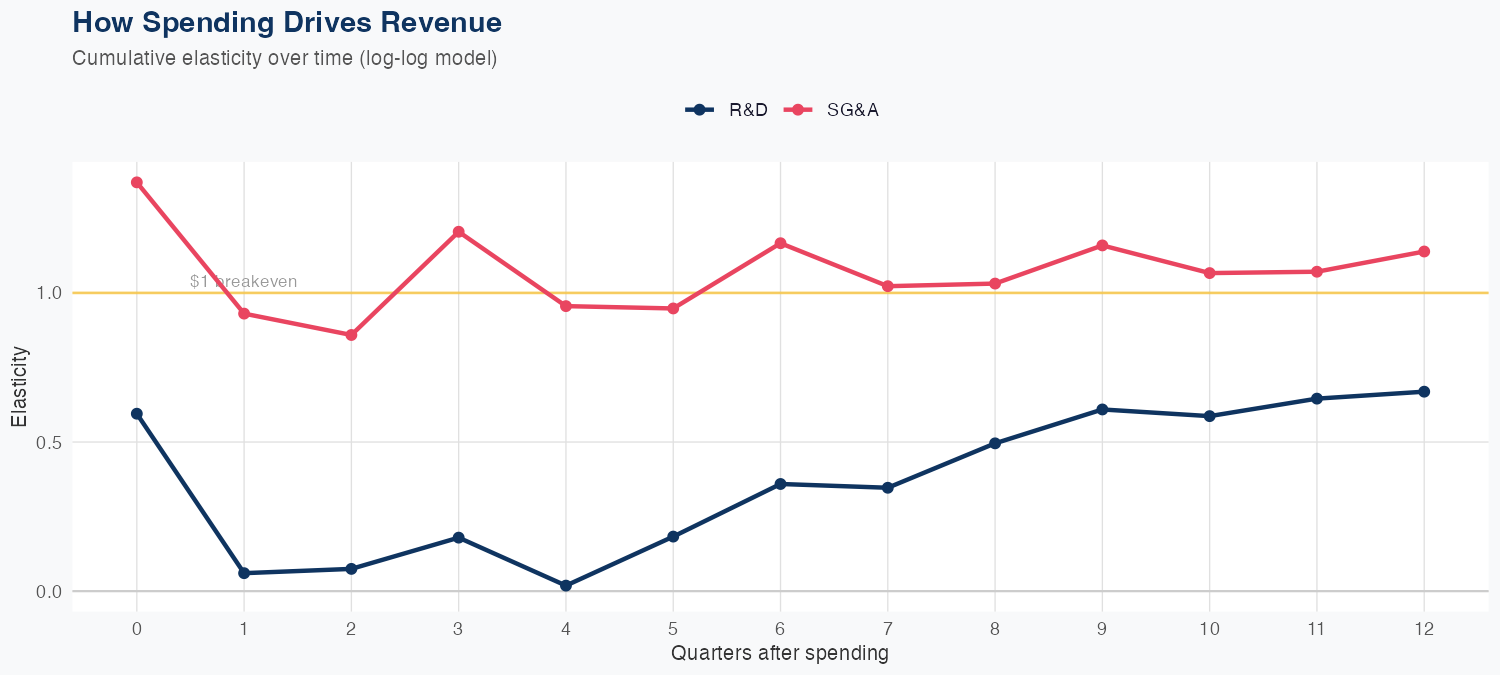
Revenue growth is driven by spending choices, with 1% more SG&A associated with 1.14% higher revenue and 1% more R&D associated with 0.67% higher revenue in a log-log framework. The latest quarter posted about $9.611B in revenue, and the model—built on 53 quarters of data with 4.9% MAPE—shows solid predictive power, with holdout results of $9.8B versus actual $9.6B (−2.4% error). The FY outlook is strong, with a revenue forecast near $50B, up 17.2% year over year, implying durable upside from scalable operations and the ROI of SG&A investments. Investors should monitor how efficiently SG&A investments translate into revenue gains, as the data suggest SG&A is the more levered near-term driver, while R&D remains a smaller but still meaningful contributor.
Investment Thesis
The econometric model achieves strong accuracy (4.9% MAPE), suggesting Deere & Co's revenue trajectory is well-characterized by its spending patterns. R&D investment shows a 0.67x multiplier — each 1% increase in R&D spend is associated with a 0.67% revenue increase, signaling strong innovation-to-revenue conversion. Sales & marketing spend shows a 1.14x elasticity, suggesting effective go-to-market execution.
Revenue Forecast
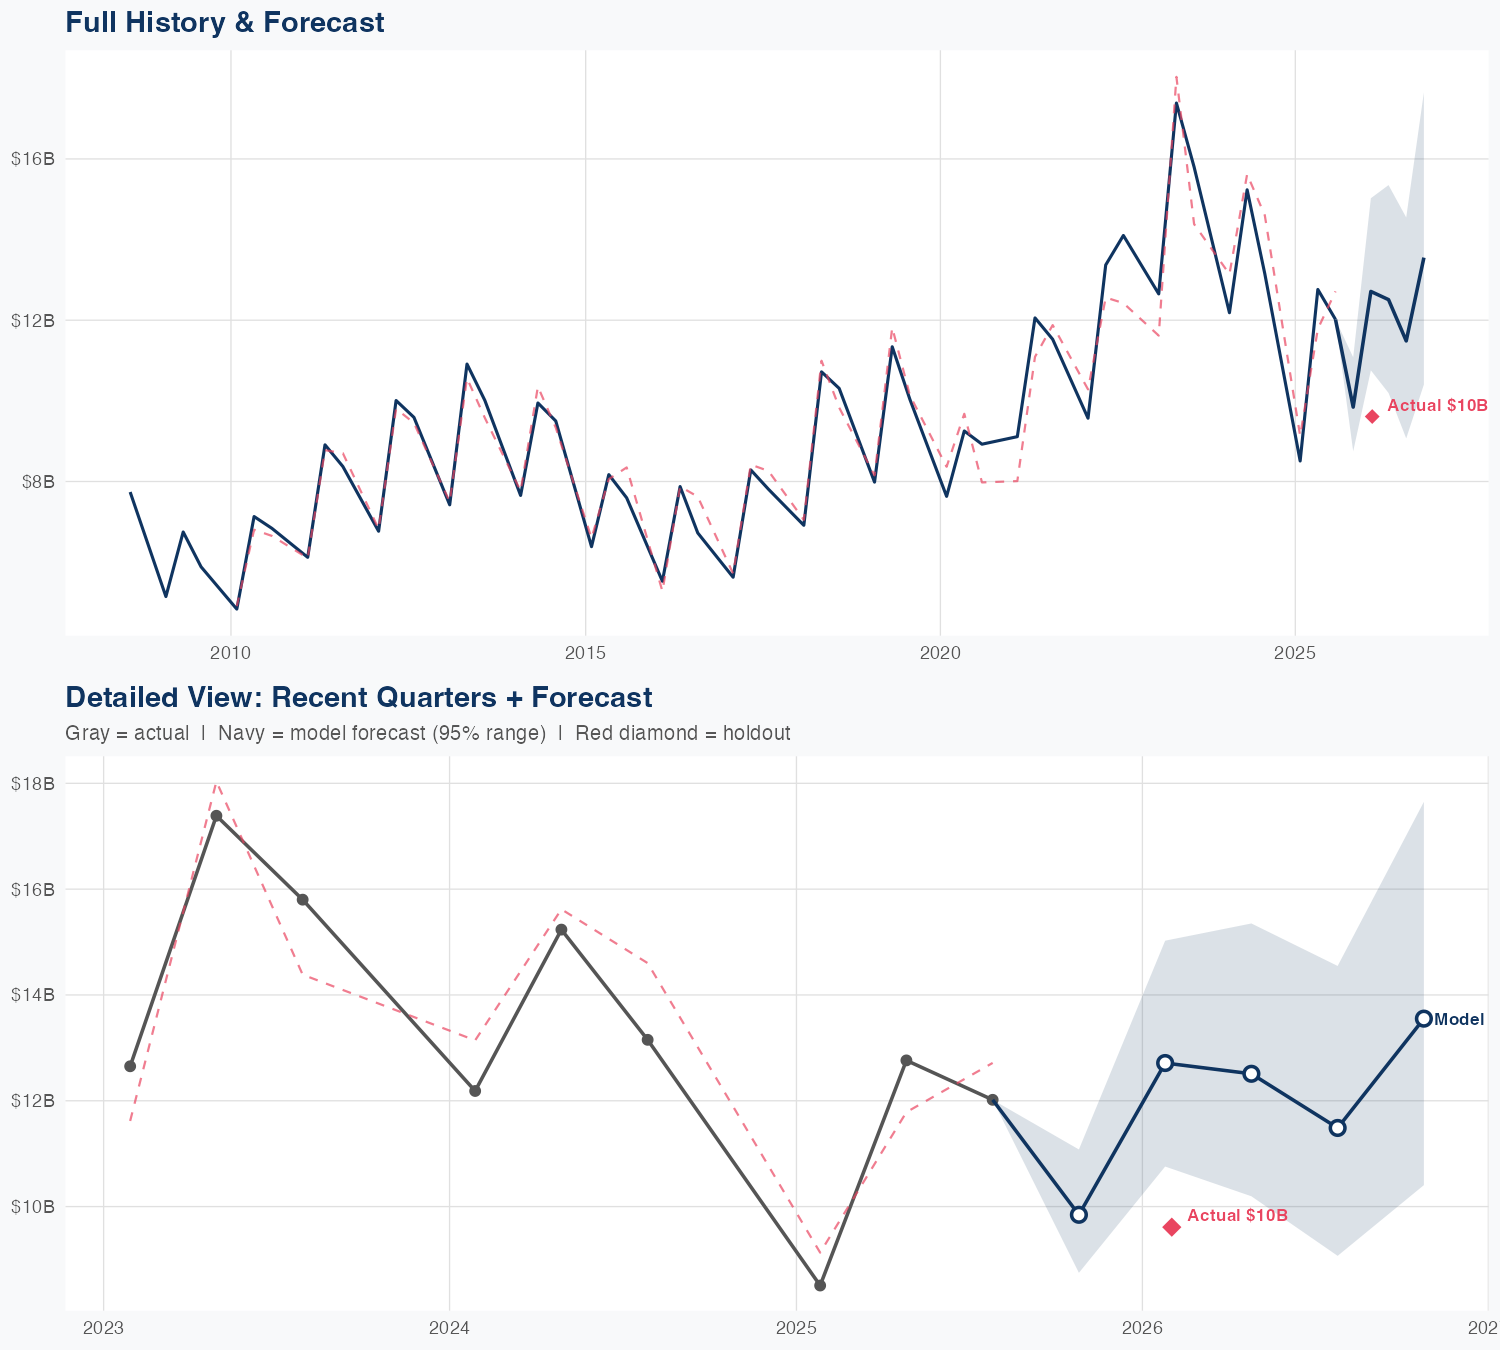
Quarterly Detail
| Quarter | Model Forecast | Actual | 95% Range | YoY Growth | Status |
|---|---|---|---|---|---|
| Q4 2025 | $9.8B | $9.6B | $8.7B – $11B | -25.1% | ✓ In range |
| Q1 2026 | $13B | $11B – $15B | +49.4% | ||
| Q2 2026 | $13B | $10B – $15B | -2.0% | ||
| Q3 2026 | $11B | $9.1B – $15B | -4.4% | ||
| Q4 2026 | $14B | $10B – $18B | +41.0% |
Seasonal Factors
| Fiscal Quarter | Seasonal Factor | vs Trend | Interpretation | Obs. |
|---|---|---|---|---|
| FQ1 (Sep–Nov) | 1.0 | +0.0% | In line with trend | 0 |
| FQ2 (Dec–Feb) | 0.9855 | -1.5% | In line with trend | 17 |
| FQ3 (Mar–May) | 1.0139 | +1.4% | In line with trend | 16 |
| FQ4 (Jun–Aug) | 1.0147 | +1.5% | In line with trend | 16 |
How Spending Drives Revenue
Want this analysis for your portfolio?
I build custom revenue intelligence reports for investors and companies using SEC filing data, econometric modeling, and AI-powered insights.
Get in Touch