Ebay Inc. EBAY
Revenue Intelligence Report • 68 quarters of SEC filing data • Updated 2026-03-15
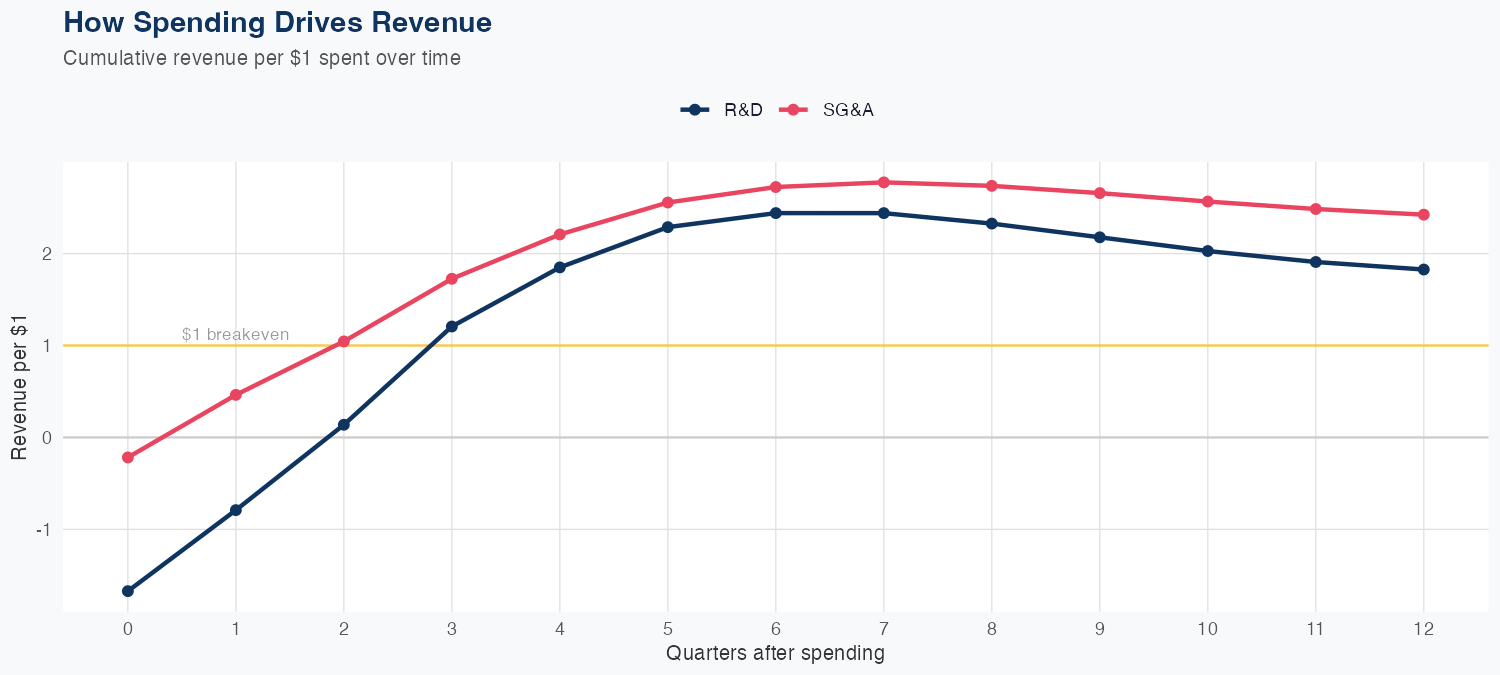
Revenue growth is driven by efficient spending, with each $1 of SG&A generating $2.46 of long-run revenue and each $1 of R&D generating $1.91, making SG&A the more potent lever for scalable revenue. The model is linear, built on 68 quarters of history, with 5.0% MAPE and a holdout error of 1.1% (predicted 2.9B vs actual 3.0B), demonstrating reliable forecasting. The latest quarterly revenue is $2.965B, aligning with the model’s recent accuracy and growth signals. The FY projection is $12B, up 7.8% year over year, suggesting sustainable growth driven by SG&A efficiency with additional incremental lift from R&D investments.
Investment Thesis
The econometric model achieves strong accuracy (5.0% MAPE), suggesting Ebay Inc.'s revenue trajectory is well-characterized by its spending patterns. Every $1 of R&D investment is associated with $1.91 of revenue, indicating efficient capital deployment in innovation. Each $1 of SG&A spending generates $2.46 in revenue, reflecting strong commercial efficiency.
Revenue Forecast
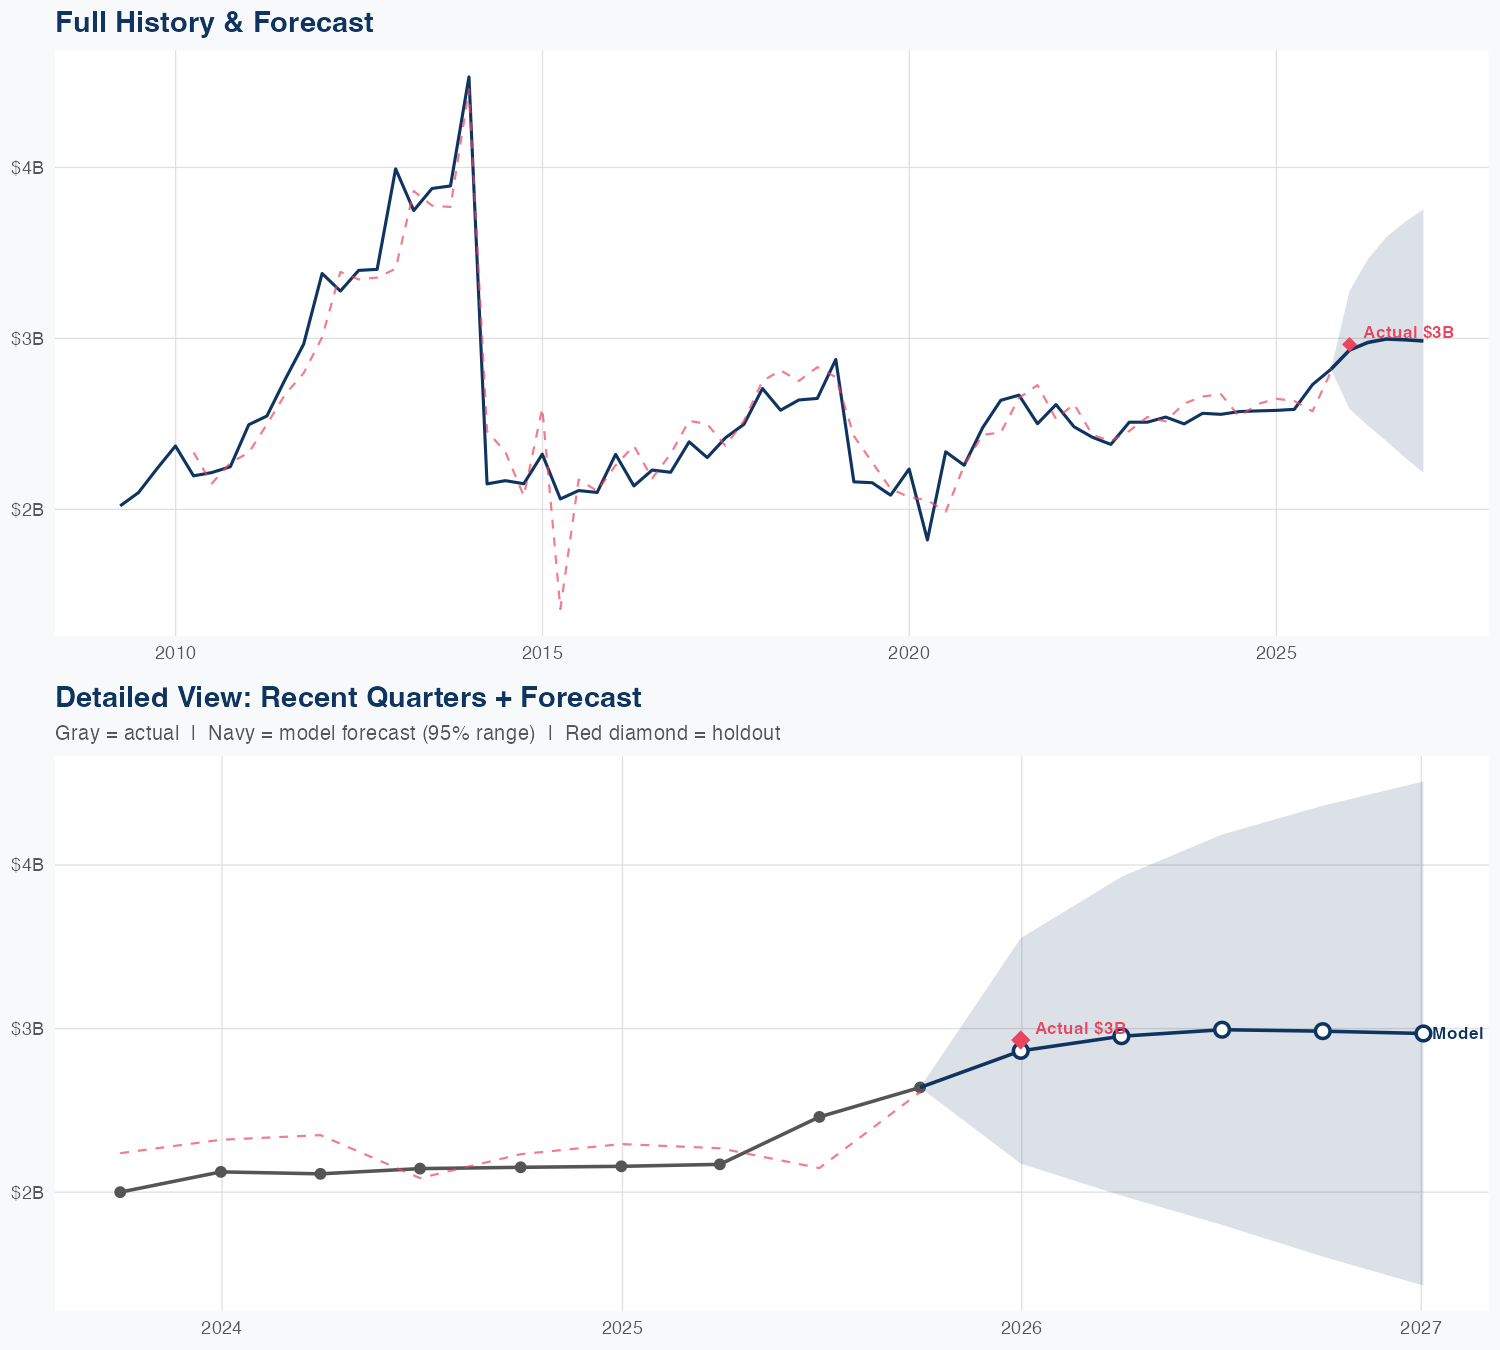
Quarterly Detail
| Quarter | Model Forecast | Actual | 95% Range | YoY Growth | Status |
|---|---|---|---|---|---|
| Q4 2025 | $2.9B | $3.0B | $2.6B – $3.3B | +13.7% | ✓ In range |
| Q2 2026 | $3.0B | $2.5B – $3.5B | +15.2% | ||
| Q3 2026 | $3.0B | $2.4B – $3.6B | +9.9% | ||
| Q4 2026 | $3.0B | $2.3B – $3.7B | +6.3% | ||
| Q1 2027 | $3.0B | $2.2B – $3.8B | +0.9% |
Seasonal Factors
| Fiscal Quarter | Seasonal Factor | vs Trend | Interpretation | Obs. |
|---|---|---|---|---|
| FQ1 (Sep–Nov) | 0.9958 | -0.4% | In line with trend | 16 |
| FQ2 (Dec–Feb) | 1.0217 | +2.2% | In line with trend | 16 |
| FQ3 (Mar–May) | 0.9543 | -4.6% | -4.6% below trend | 16 |
| FQ4 (Jun–Aug) | 1.0153 | +1.5% | In line with trend | 16 |
How Spending Drives Revenue
Want this analysis for your portfolio?
I build custom revenue intelligence reports for investors and companies using SEC filing data, econometric modeling, and AI-powered insights.
Get in Touch