Estee Lauder Companies Inc EL
Revenue Intelligence Report • 50 quarters of SEC filing data • Updated 2026-03-15
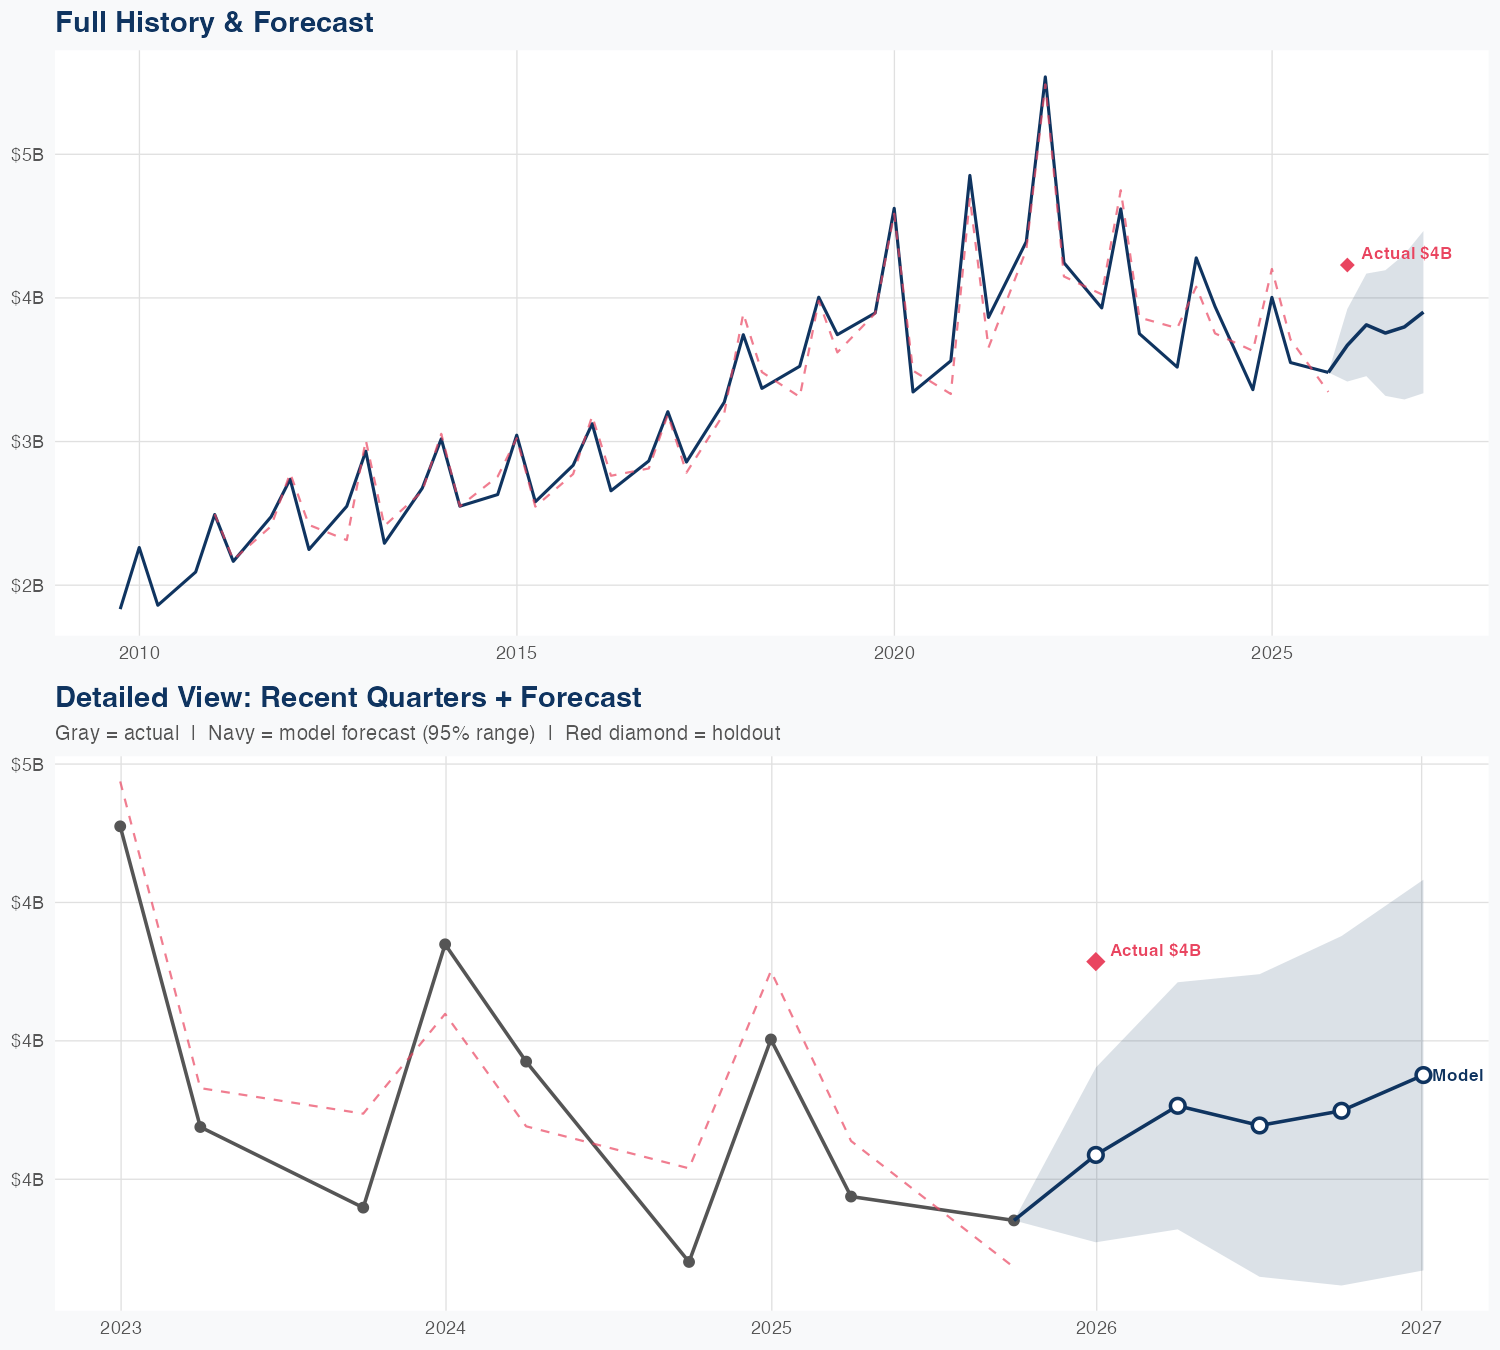
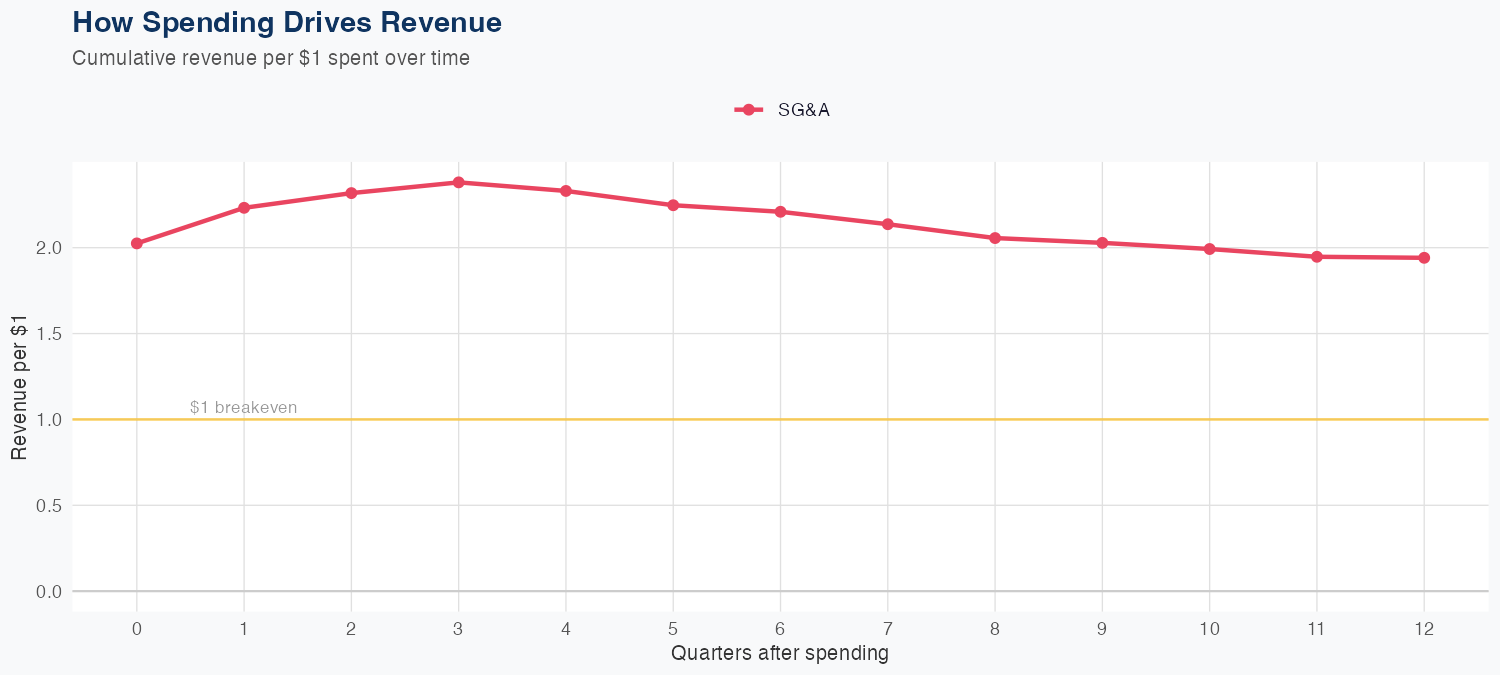
Revenue is primarily driven by SG&A spending efficiency, with the model estimating that every $1 of SG&A generates about $1.94 of long-run revenue. R&D data are not available, so product-development impact cannot be quantified, and the framework relies on 50 quarters of SG&A–revenue history under a linear assumption. The model shows 3.1% MAPE overall accuracy, but a holdout quarterly forecast of $3.7B versus actual $4.2B produced a 13.2% error, signaling some near-term forecasting risk. The FY revenue outlook is $15B, flat year over year, implying limited top-line growth and a continued emphasis on SG&A efficiency to sustain gains.
Investment Thesis
The econometric model achieves strong accuracy (3.1% MAPE), suggesting Estee Lauder Companies Inc's revenue trajectory is well-characterized by its spending patterns. Each $1 of SG&A spending generates $1.94 in revenue, reflecting strong commercial efficiency.
Revenue Forecast
Quarterly Detail
| Quarter | Model Forecast | Actual | 95% Range | YoY Growth | Status |
|---|---|---|---|---|---|
| Q4 2025 | $3.7B | $4.2B | $3.4B – $3.9B | +9.2% | ✗ Outside range |
| Q2 2026 | $3.8B | $3.5B – $4.2B | -4.8% | ||
| Q3 2026 | $3.8B | $3.3B – $4.2B | +5.8% | ||
| Q4 2026 | $3.8B | $3.3B – $4.3B | +9.1% | ||
| Q1 2027 | $3.9B | $3.3B – $4.5B | -7.8% |
Seasonal Factors
| Fiscal Quarter | Seasonal Factor | vs Trend | Interpretation | Obs. |
|---|---|---|---|---|
| FQ1 (Sep–Nov) | 1.0186 | +1.9% | In line with trend | 15 |
| FQ2 (Dec–Feb) | 0.9997 | -0.0% | In line with trend | 16 |
| FQ3 (Mar–May) | 0.9949 | -0.5% | In line with trend | 15 |
| FQ4 (Jun–Aug) | 1.0 | +0.0% | In line with trend | 0 |
How Spending Drives Revenue
Want this analysis for your portfolio?
I build custom revenue intelligence reports for investors and companies using SEC filing data, econometric modeling, and AI-powered insights.
Get in Touch