Gen Digital Inc. GEN
Revenue Intelligence Report • 54 quarters of SEC filing data • Updated 2026-03-15
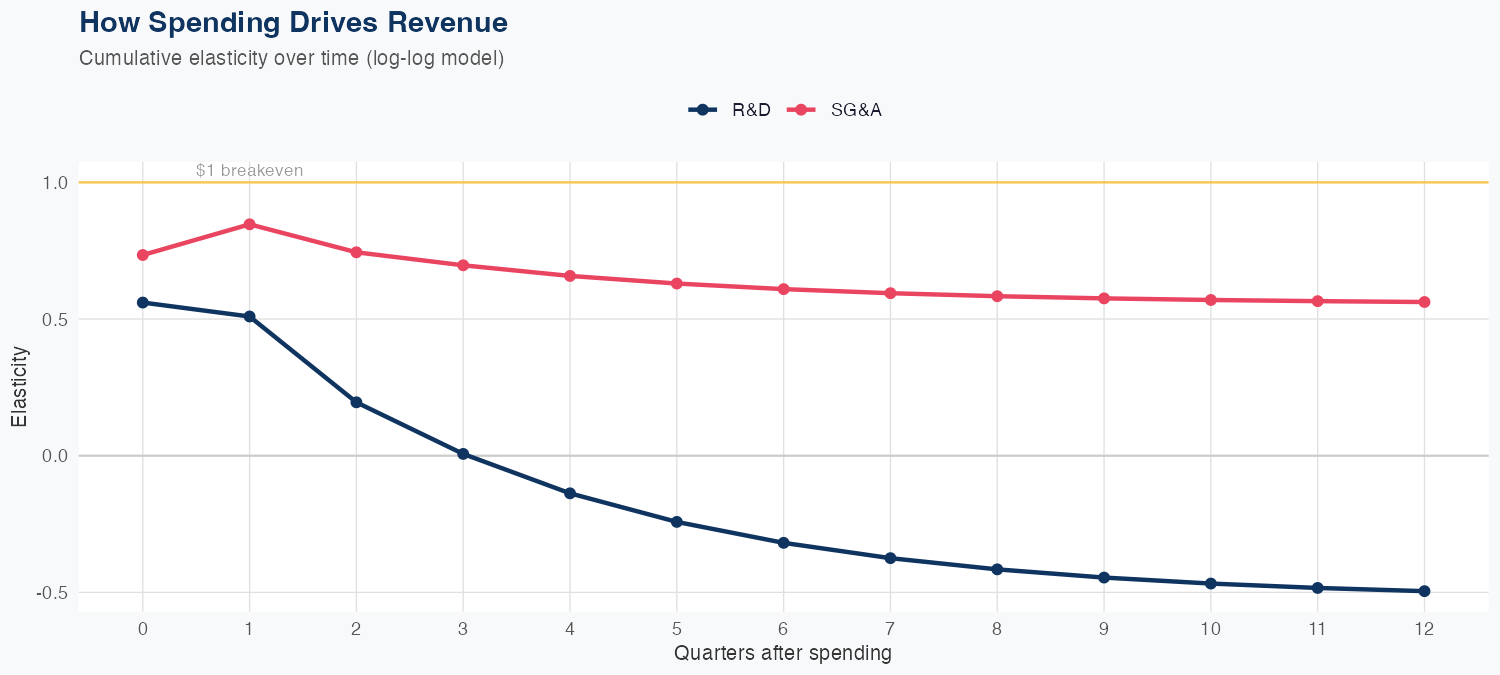
Revenue is primarily driven by SG&A spend, with a 1% increase in SG&A yielding about a 0.77% rise in revenue, while a 1% increase in R&D correlates with a -0.37% change in revenue, under a log-log framework. The elasticity signals limited ROI from R&D and a modest revenue lift from SG&A, but the model’s predictive power is modest (MAPE 43.6%) and holdout error was 30.2% (predicted 0.9B vs actual 1.2B), signaling considerable uncertainty. The FY outlook calls for roughly $3.8B in revenue, down 18.5% year over year, implying a meaningful revenue contraction despite SG&A-driven gains and raising questions about profitability and cash flow under tighter top-line prospects. Given the model limits, investors should scrutinize SG&A efficiency and consider additional drivers beyond these elasticities when assessing ROI and the outlook.
Investment Thesis
At 43.6% MAPE, the model captures Gen Digital Inc.'s broad revenue trajectory, though quarterly variability suggests sensitivity to external factors. R&D spending currently shows a negative elasticity (-0.37x), which can indicate heavy investment in long-cycle initiatives not yet reflected in revenue. Sales & marketing spend shows a 0.77x elasticity, suggesting effective go-to-market execution.
Revenue Forecast
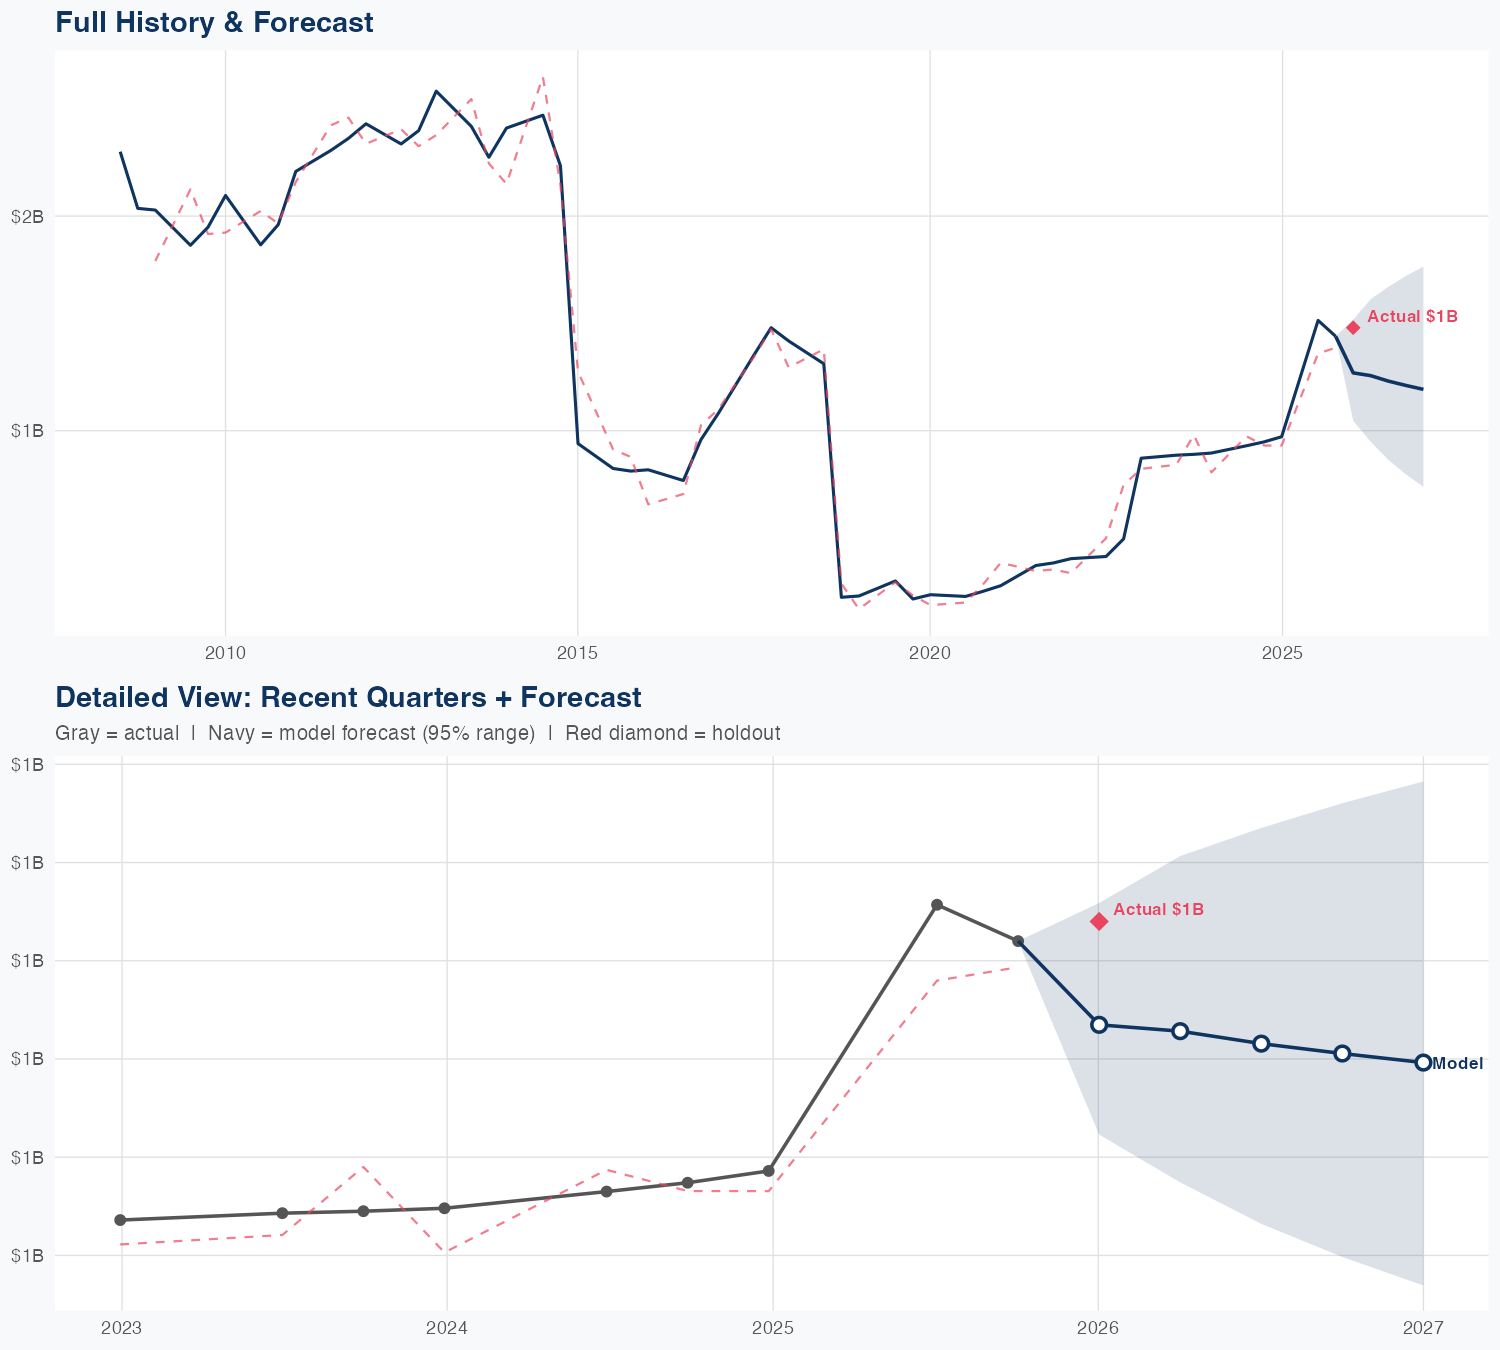
Quarterly Detail
| Quarter | Model Forecast | Actual | 95% Range | YoY Growth | Status |
|---|---|---|---|---|---|
| Q1 2026 | $0.9B | $1.2B | $0.4B – $2.0B | -11.2% | ✓ In range |
| Q2 2026 | $1.0B | $0.3B – $3.2B | -2.2% | ||
| Q3 2026 | $1.0B | $0.2B – $4.2B | -24.1% | ||
| Q4 2026 | $1.0B | $0.2B – $5.4B | -19.5% | ||
| Q1 2027 | $0.9B | $0.1B – $6.3B | -24.9% |
Seasonal Factors
| Fiscal Quarter | Seasonal Factor | vs Trend | Interpretation | Obs. |
|---|---|---|---|---|
| FQ1 (Sep–Nov) | 1.0786 | +7.9% | +7.9% above trend | 17 |
| FQ2 (Dec–Feb) | 1.0118 | +1.2% | In line with trend | 17 |
| FQ3 (Mar–May) | 1.0 | +0.0% | In line with trend | 0 |
| FQ4 (Jun–Aug) | 0.9971 | -0.3% | In line with trend | 16 |
How Spending Drives Revenue
Want this analysis for your portfolio?
I build custom revenue intelligence reports for investors and companies using SEC filing data, econometric modeling, and AI-powered insights.
Get in Touch